 FarmingTechnologies
| Traction and Slip figure |
| Power to the ground |
The measure of the vehicle performance is the first step for the vehicle devepment.
The measure of all energy parameters like power, torque, vehicle speed, traction, fuel consumption, spec f.c.,... performed when the vehicle is running and all parameters change quickly, in one word the Dynamic Measure, provides results and values slightly (and in some case noticeably) different from the Stationary test (nothing changes, or changes are very slow, d/dt=0).
The excellent knowledge of the instrumentation chain is the key point to ensure reliable data logging and analysis, that, in addition to most accurate recording in the real operative conditions, ensures the best support for any vehicle development.
Comparative Vehicle Testing
| Few data to understand the analysis |
The reliable test procedure, combined with the best expertise about both data logging and Tractor technical background, are the basis to achieve the excellence in terms Comparison between Competitors: the test objective is to provide an energy balance in Field, precisely calculating the power flows through each vehicle group/part of the vehicle for each main operation (ploughing, power harrowing, haulage,..)
An alternative option.
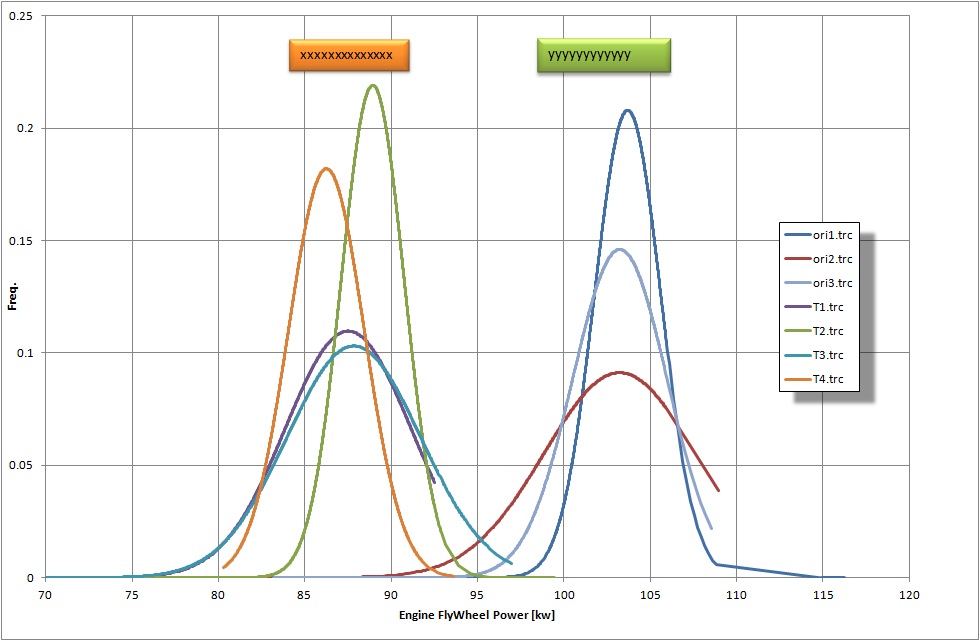
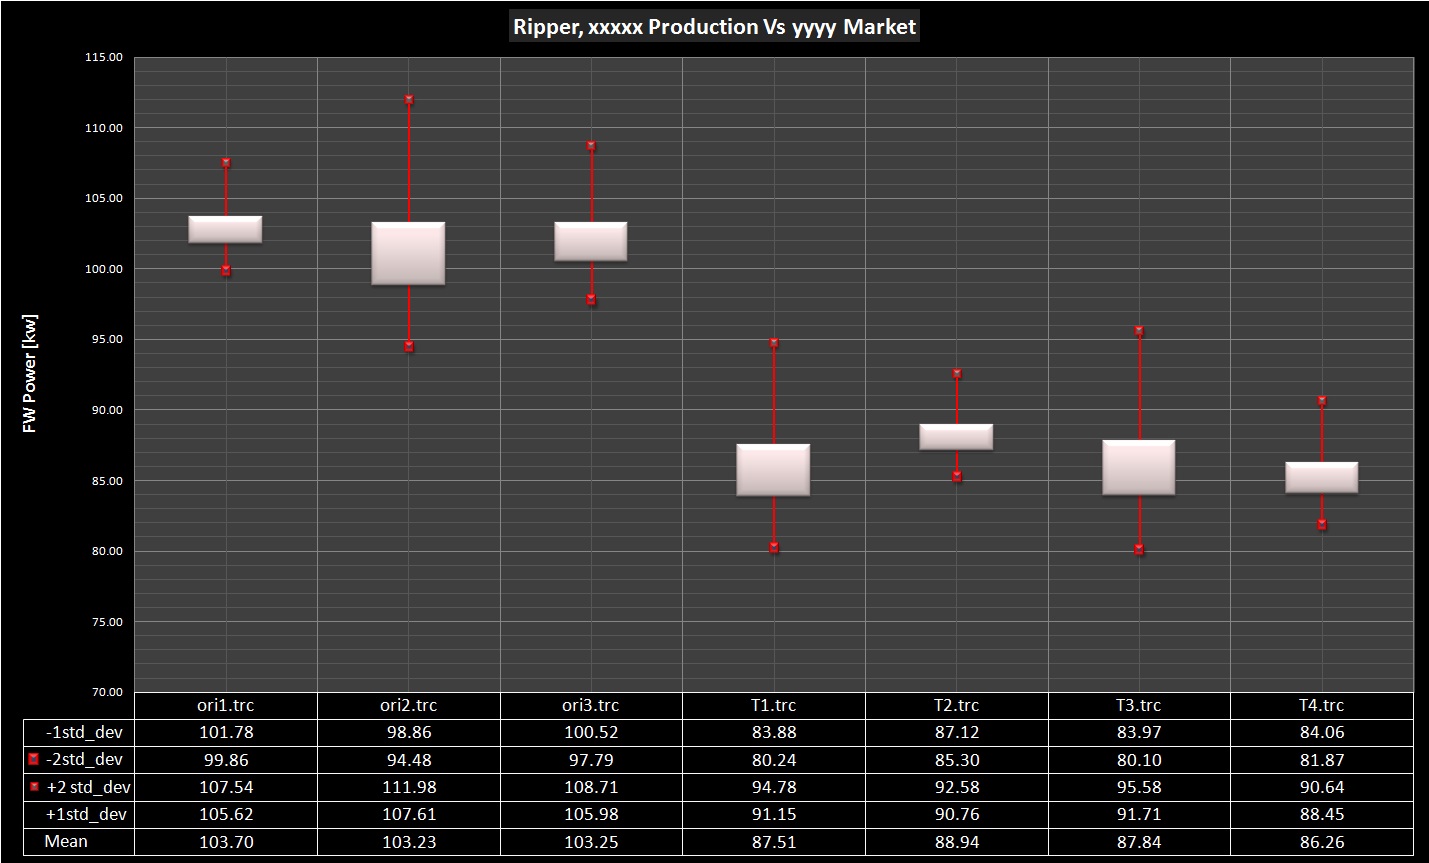
Considering that the former approach is based on the measure and/or the estimation of each energy flow, it requires a certain time for test preparation ( sensor installation, calibration,..), for this reason in some occasion of fast result need could be convenient a statistical analysis: the main assumption is to consider statistically the parameter of interest only and assuming all other parameter as variants depending on the test condition so when replicating the test condition all other variables provide the same contribution.
| Gaussian |
| Mean&Std_Dev |
Vehicle architecture
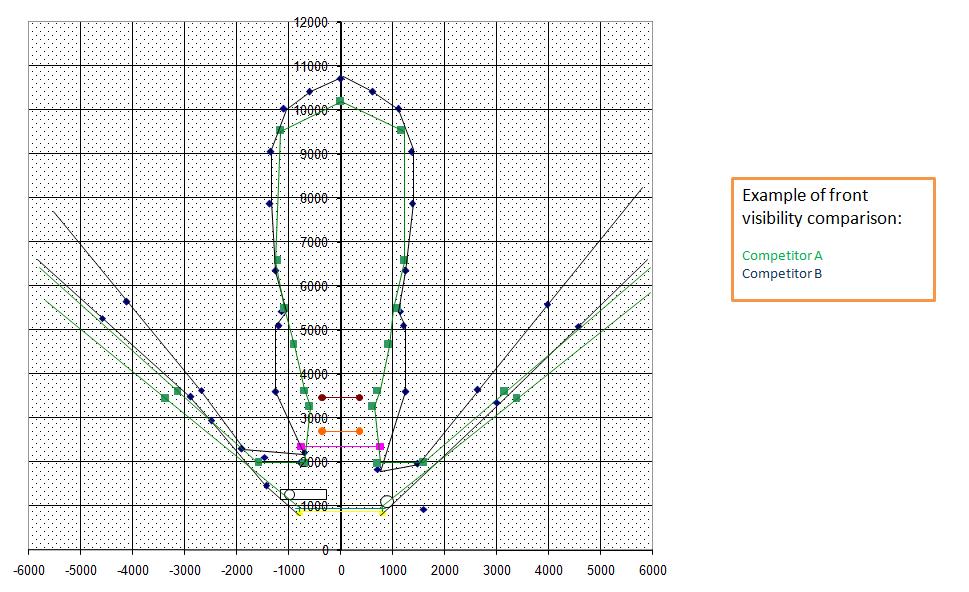
| Front Visibility |
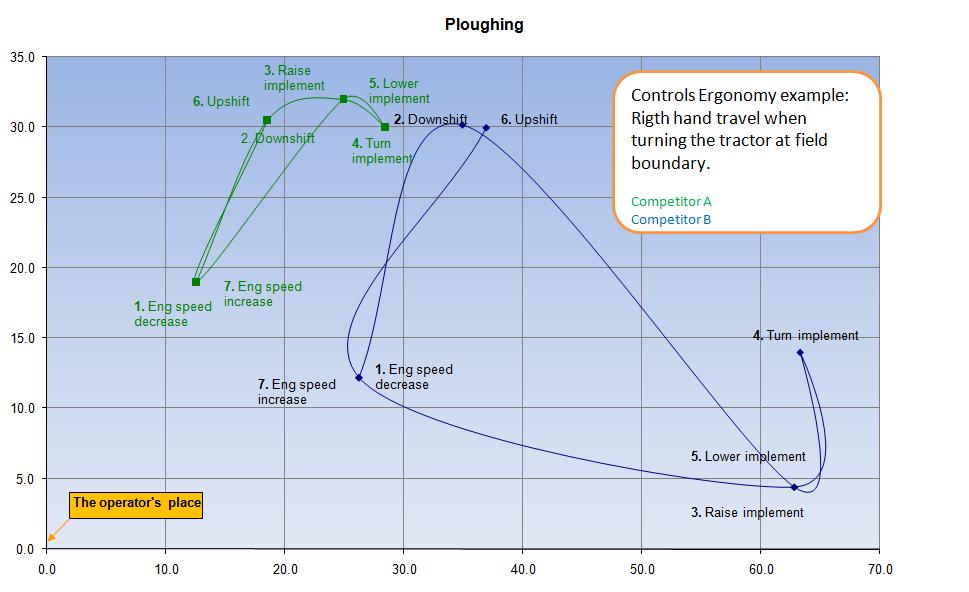
| Control Ergonomy |
More and more:
We can calculate the view from the operator station that is the vehicle shadow to the ground, we can support the control ergonomy suggesting the best position, we can even study Noise and vibrations probelems by spectral analysis.
Pto Test
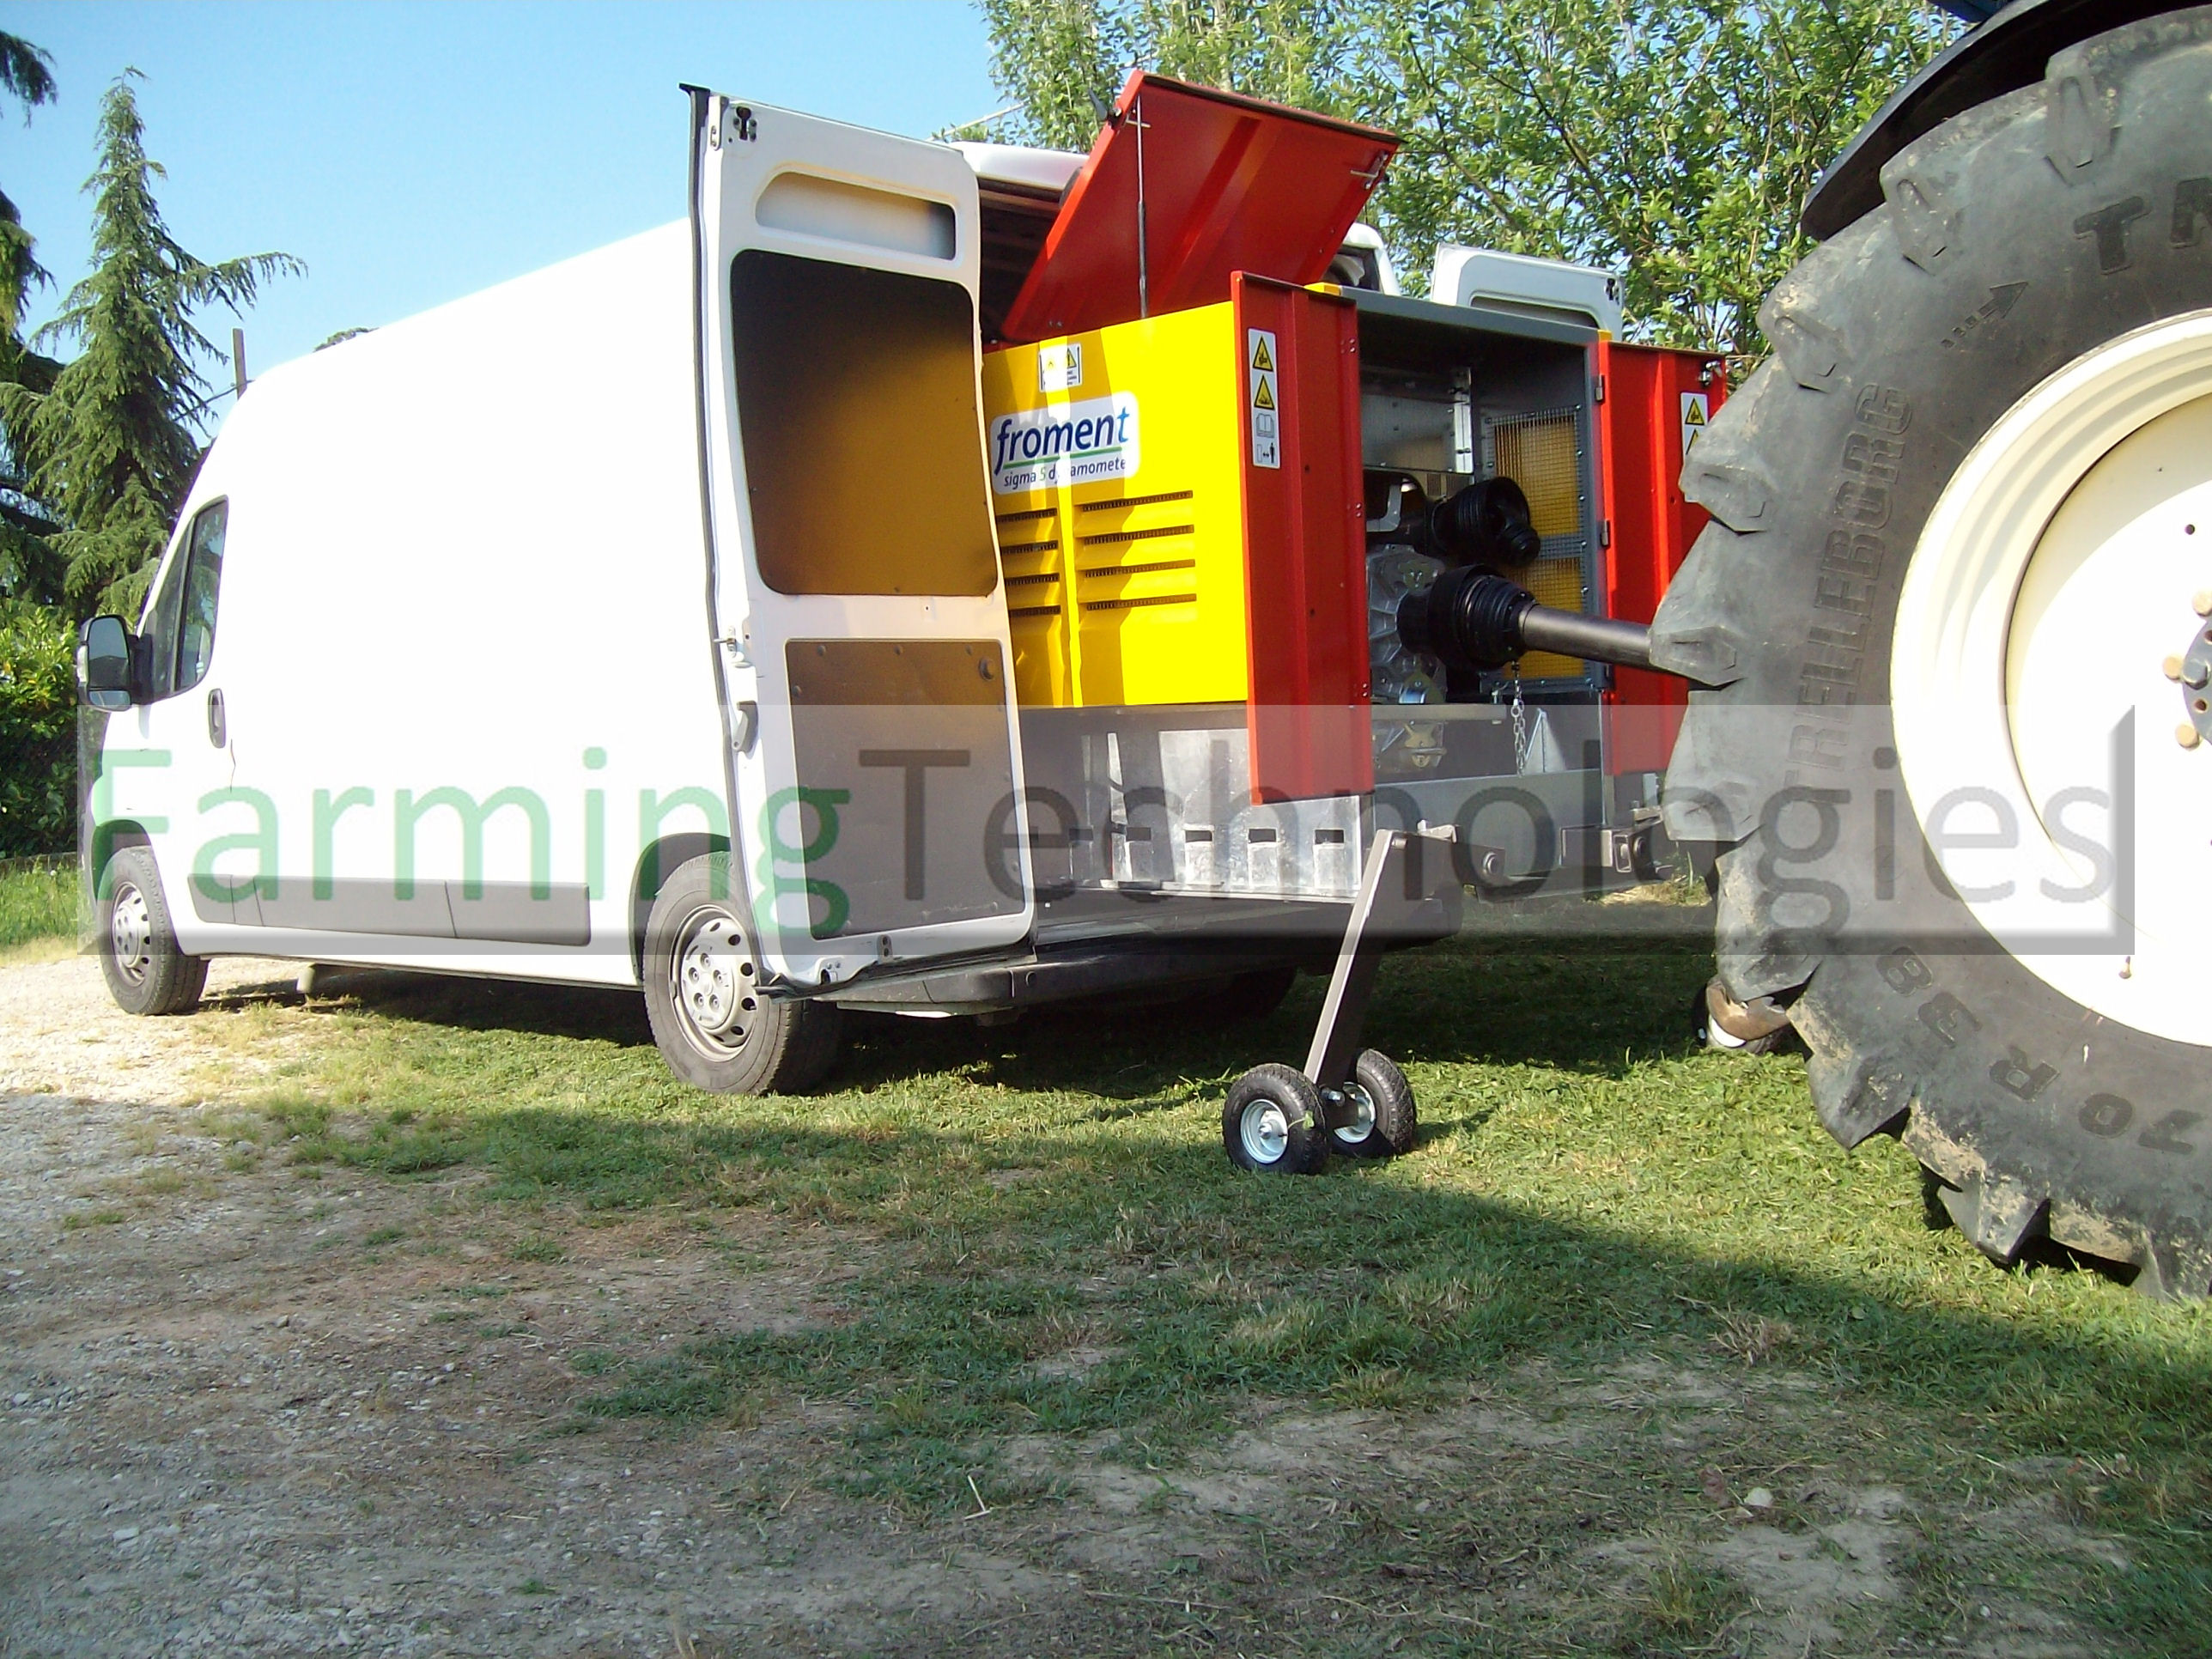
| PTO Test |
We can test Power and Torque, up to 450 hp, by a powerful and precise dynamometer to Pto shaft and even to the engine flywheel.
We can perform:
- Pto power test curve (stationary)
- Dynamic engine response to a certain peak of torque
- HFC (hourly fuel consumption)
- BSFC (brake specific fuel consumption),
- Reading of CAN messages and ECU signals and compare them with the output power,
- Stationary Pto energy balance depending on different variables (transmission oil temperature, engaged gear,..),
- Cooling System Evaluation (coolant, air, fuel), ATB test, Hot Shout Down test
- Replicate a certain load profile (recorded in field) then simulating the engine behaviour
- ...and more
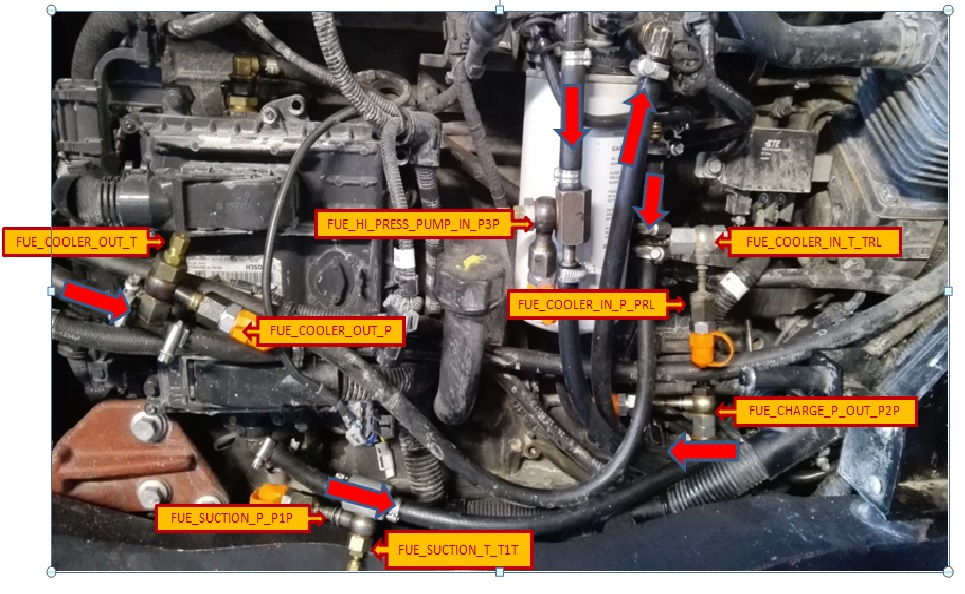
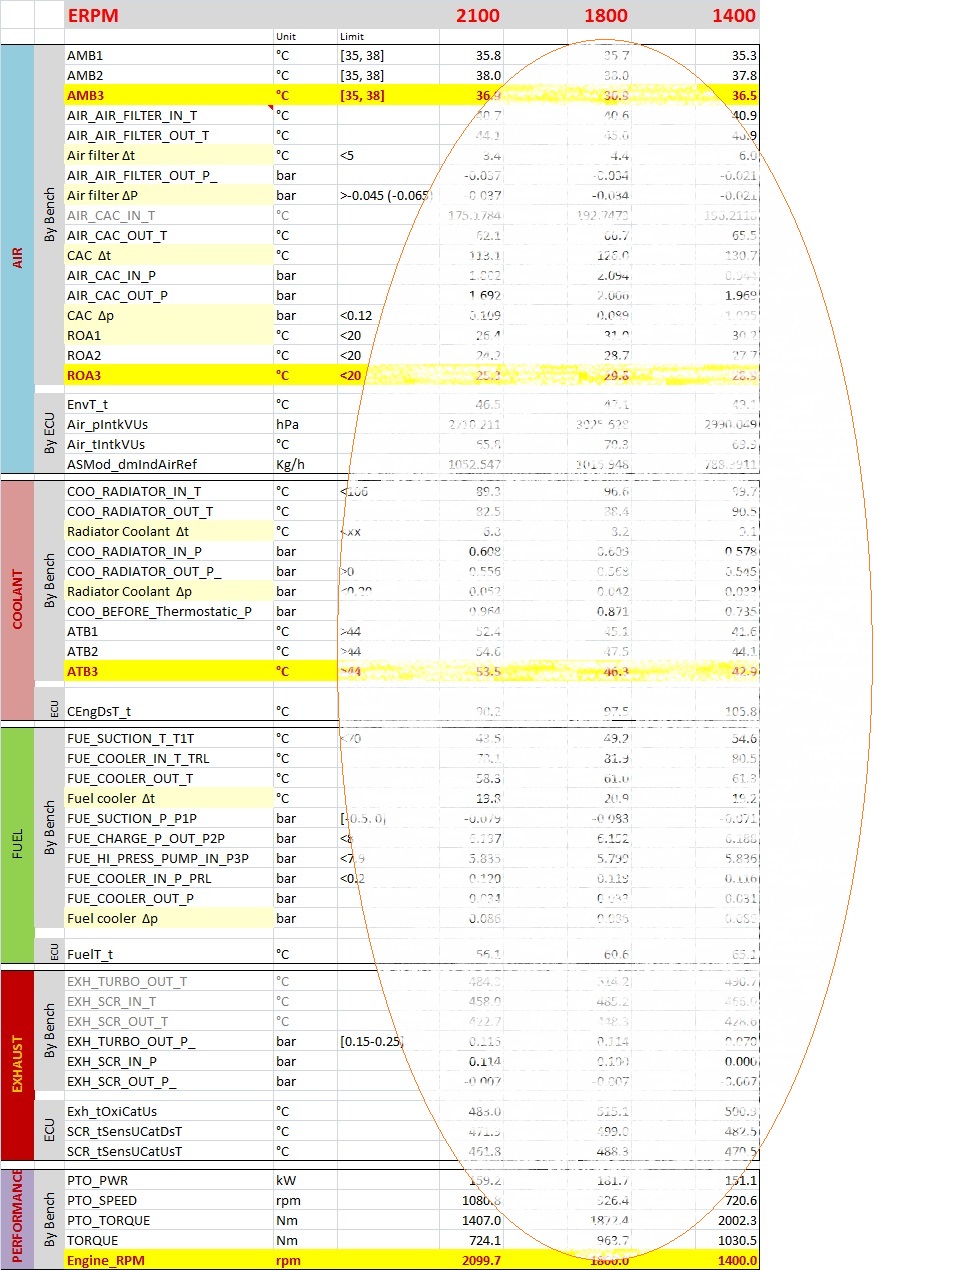
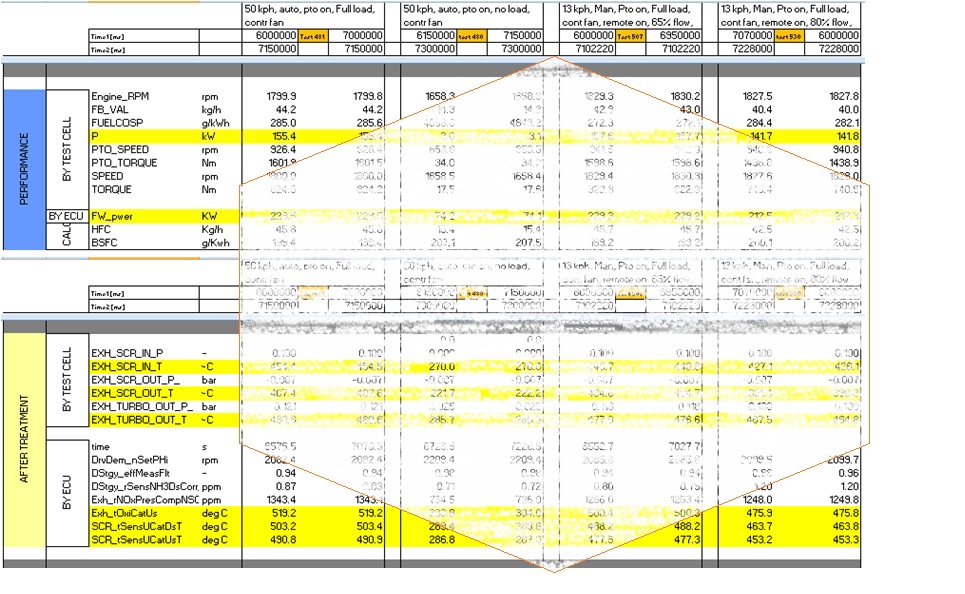
Engine installation
In this section a quick hint of engine installation tests, sometimes the test are compliance test with the requirement of the engine manufacturer.
- Engine cooling ( coolant, air, temperatures, pressures,..9
- Fuel line (temperatures, pressures,..)
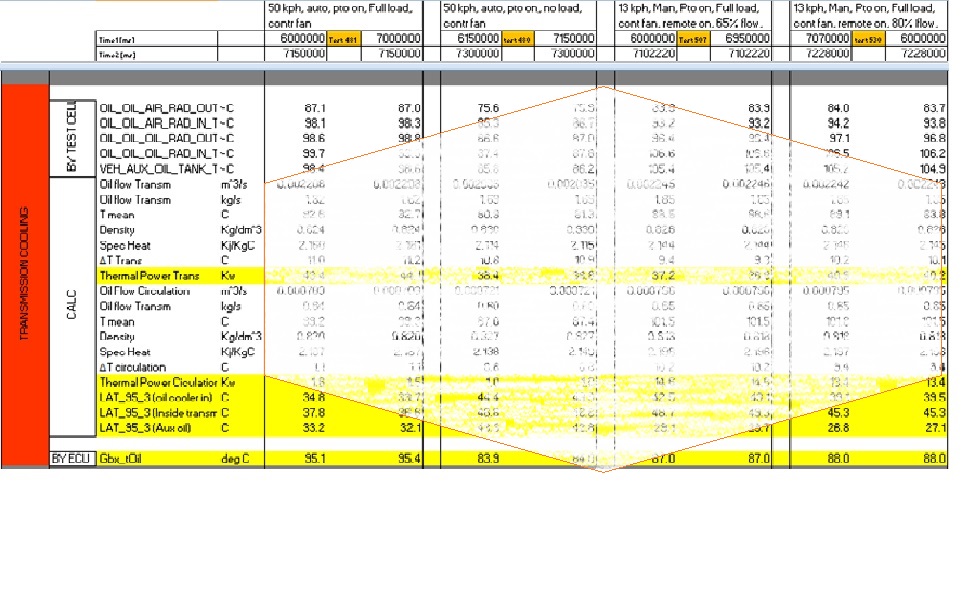
- Transmission cooling
- Exhaust gas and After treatment
- Performance tests (stationary, transient,..)
- Engine curves design and evaluation
| Few Transducers |
| Engine Coolant&Air |
| Transmission_cooling |
| Eng_performance & AT |
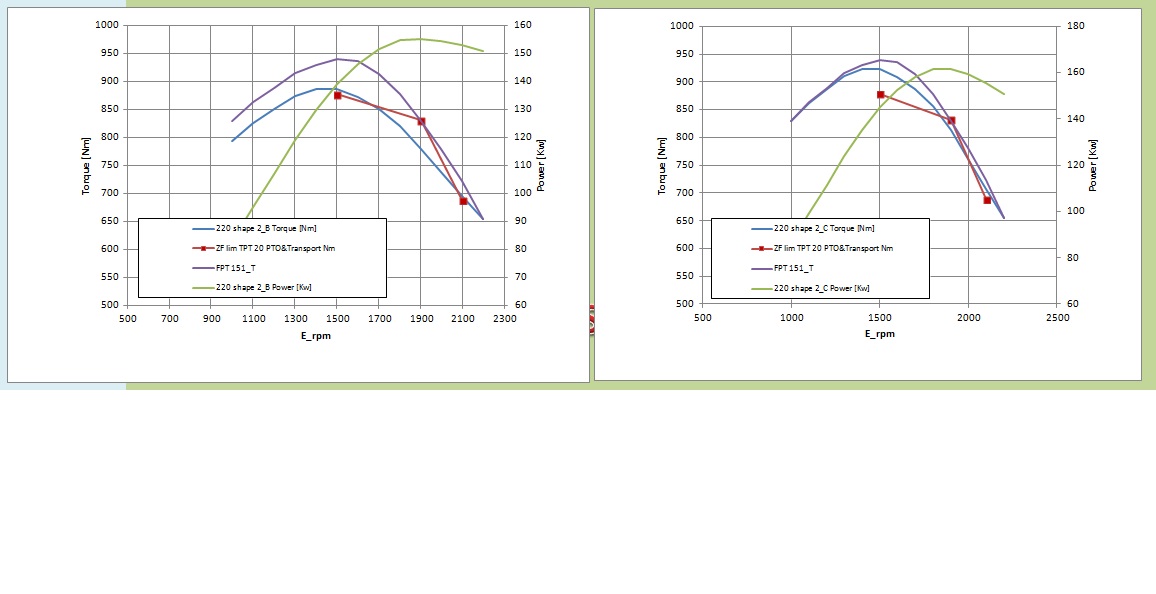
The engine curves design is an efficient way for:
- Generating different models inside tractor family
- Providing two or more engine power curve depending on vehicle usage (i.e. Boosted, Unbosteed curves,..)
- Meeting the torque transmission limitation
There are al least two methods:
- MultipleStateSwitch (BC2EDC1): The different engine curves are loaded on ECU, VCM can selects curves only Disadvantages: limited number of curves, homologated curves only
- Speed control & Torque limitation (TSC1): just one Curve is loaded into ECU, VCM requires a certain portion of the torque available, each request by engine speed generate a sub_curve that is below the main curve loaded into ECU. Advantages: more flexibility, no limitation for the sub curves number
| Engine_Curve_Design |
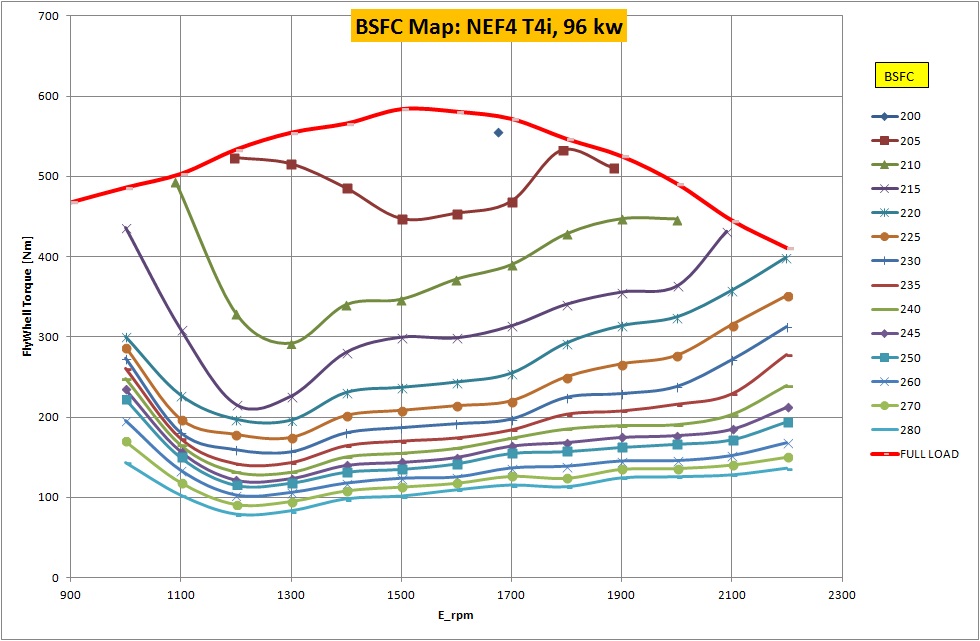
BSFC map:
In same case those data were not available from engine manufacturer, then it has been achieved from testing
| BSFC_Map |
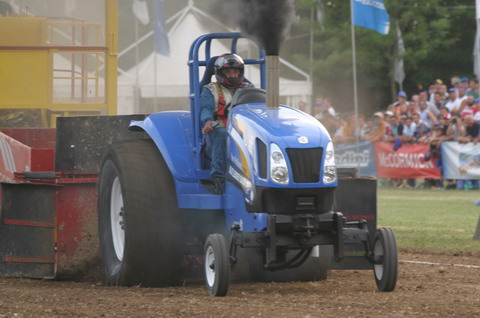
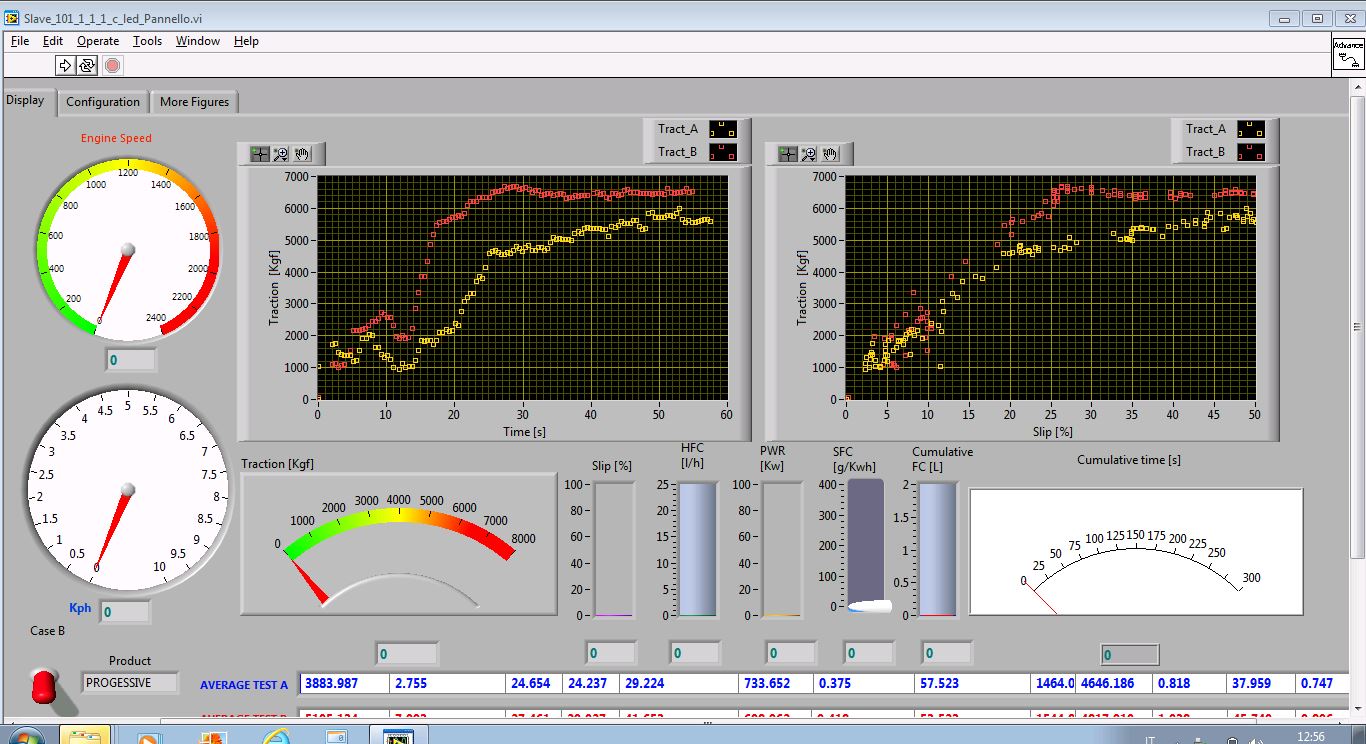
Tractor performance while field working
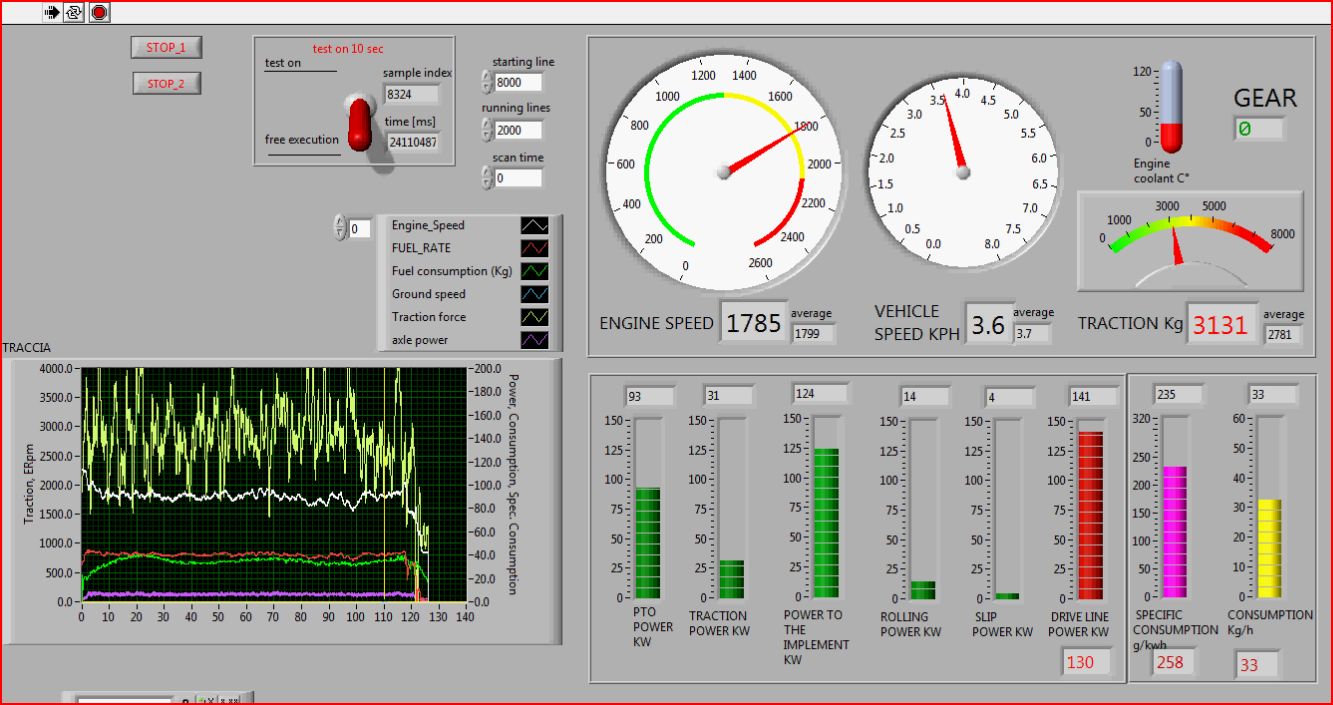
| Performance Panel |
When i started this job , about 15 years ago, the main challenge was succeeding to measure and calculate two key points while field operating:
- The main power flows through the vehicle, i mean starting from the engine establish how many net horse power are available to pull the implement and how many are lost by the engine cooling, by the transmission (depending on the oil temperature, the vehicle speed, the engine speed, the field slope,...), by the Tyres in terms of both rolling resistence and slippage
- The energy cost to achieve a certain result, in other technical words the hourly fuel consumption, and the Specific fuel consumption in all different sections of the vehicle
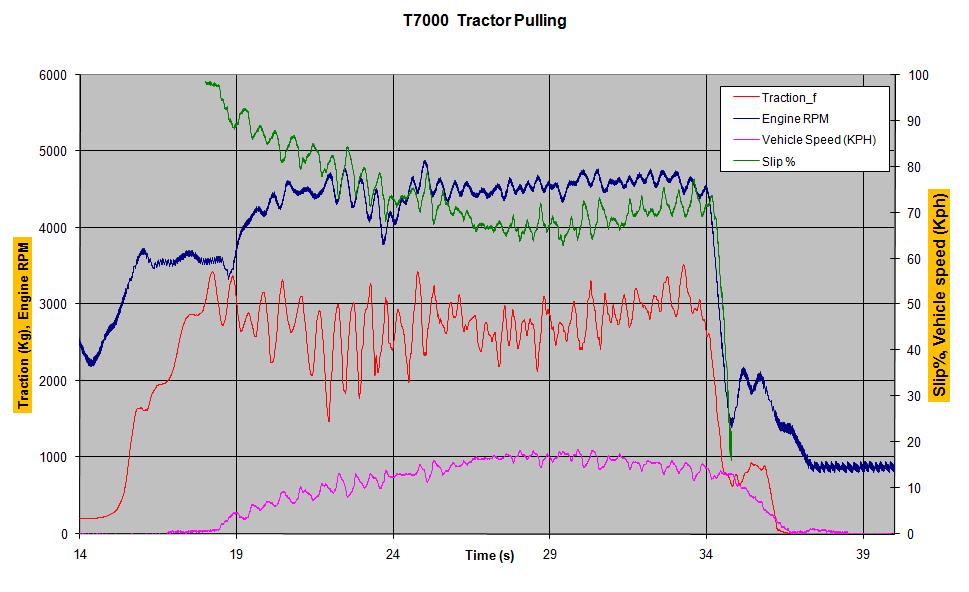
Currently, even if analog signals (from load cells, frequency, potentiometers, radars,...) are sampled at 2 kHz or higher scan rate (depending on circumstances), the results of calculations are supplied 20 times per second and realigned in the time scale with those of analog data that do not require any calculation (just averaged), CAN bus data, GPS data... in other words the final results traces are refreshed at 20 Hz.
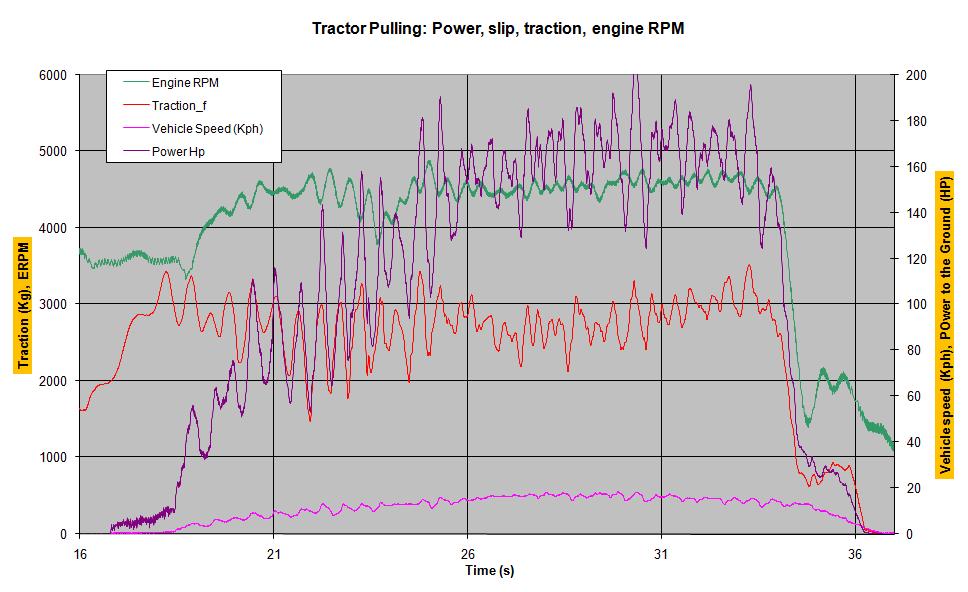
Traction Slip Characteristic
This figure is frequently required to evaluate the traction capability of both tractor and tyres. Fixing a certain ground, for tractors the traction/slip figure depends on the general setting and design: total weight, weight distribution on the axles, wheelbase, center of gravity, hitch height, tyres pressure, and tyres design; in case of use of some electronic control like diff-lock or draft control they will impact on the traction.
For Tyres, the traction depends on many design parameters like number of lugs, lug profile, lug thickness, carcass flexibility...Fixing a certain traction level some tyre can slip a few percent units less than other brands, that involves the tyre is foundamental ring in the kinemathic chain efficiency even if it is not fully understood by the tractor Companies.
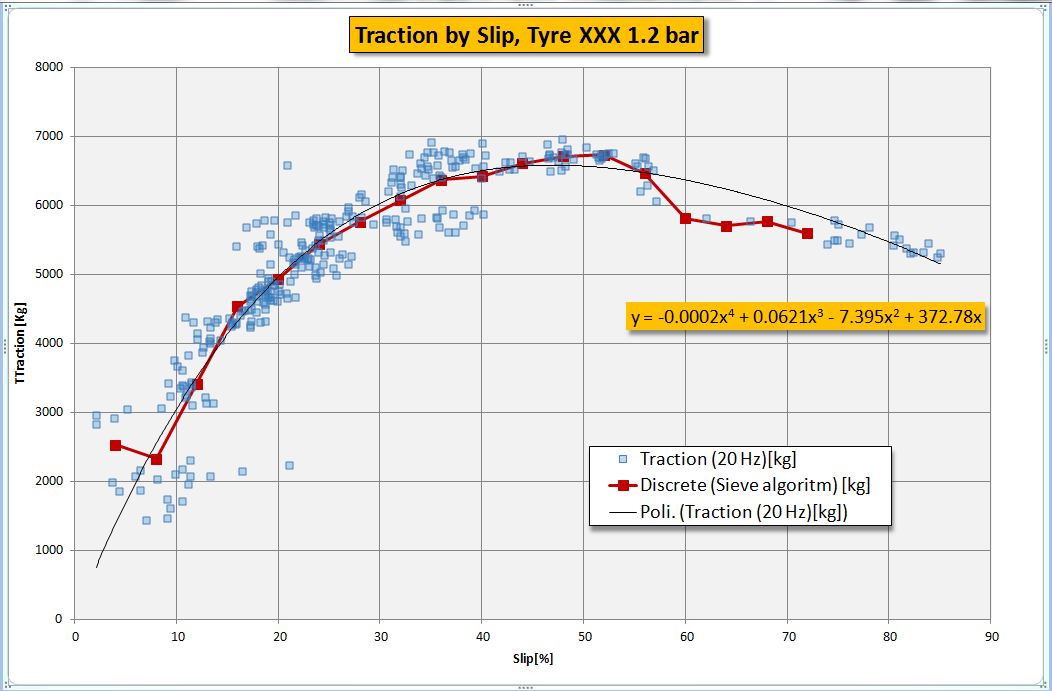
Traction Slip figure displays a typical figure measured in field: data have been recorded @ 4 kHz: the blue dot cloud has been calculated and averaged by using the 20 Hz Algoritm, the red curve has been achieved by using the Sieve Algoritm (traction by classes of slip) that is a very precise interpolation, the black curve is the polinomial made by Excell good up to 50% of slip but it is faulty further when the number of samples decrease.
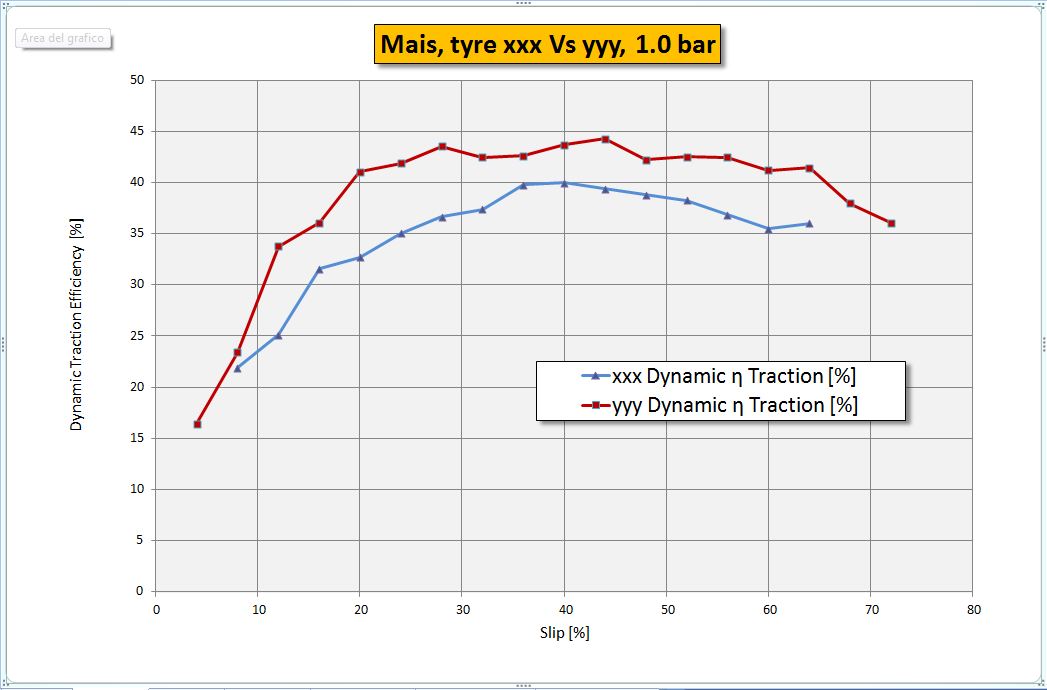
Traction Efficiency figure displays the ratio Traction / Weight, were Weight i the real dynamic weight on tyre (a typical mistake of many engineers is to use the stationary weight without taking in account of the weight transfer due to the traction momentum), the figure gives us an idea of the difference of traction between tyre brands.
| Traction_Slip figure |
| Traction Efficiency |
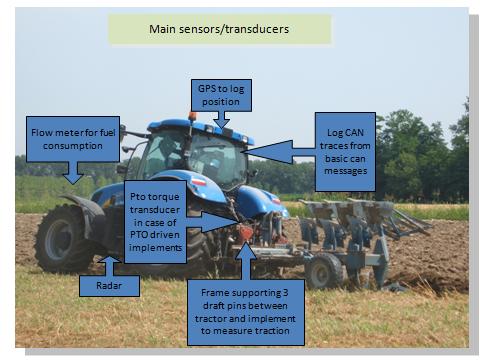
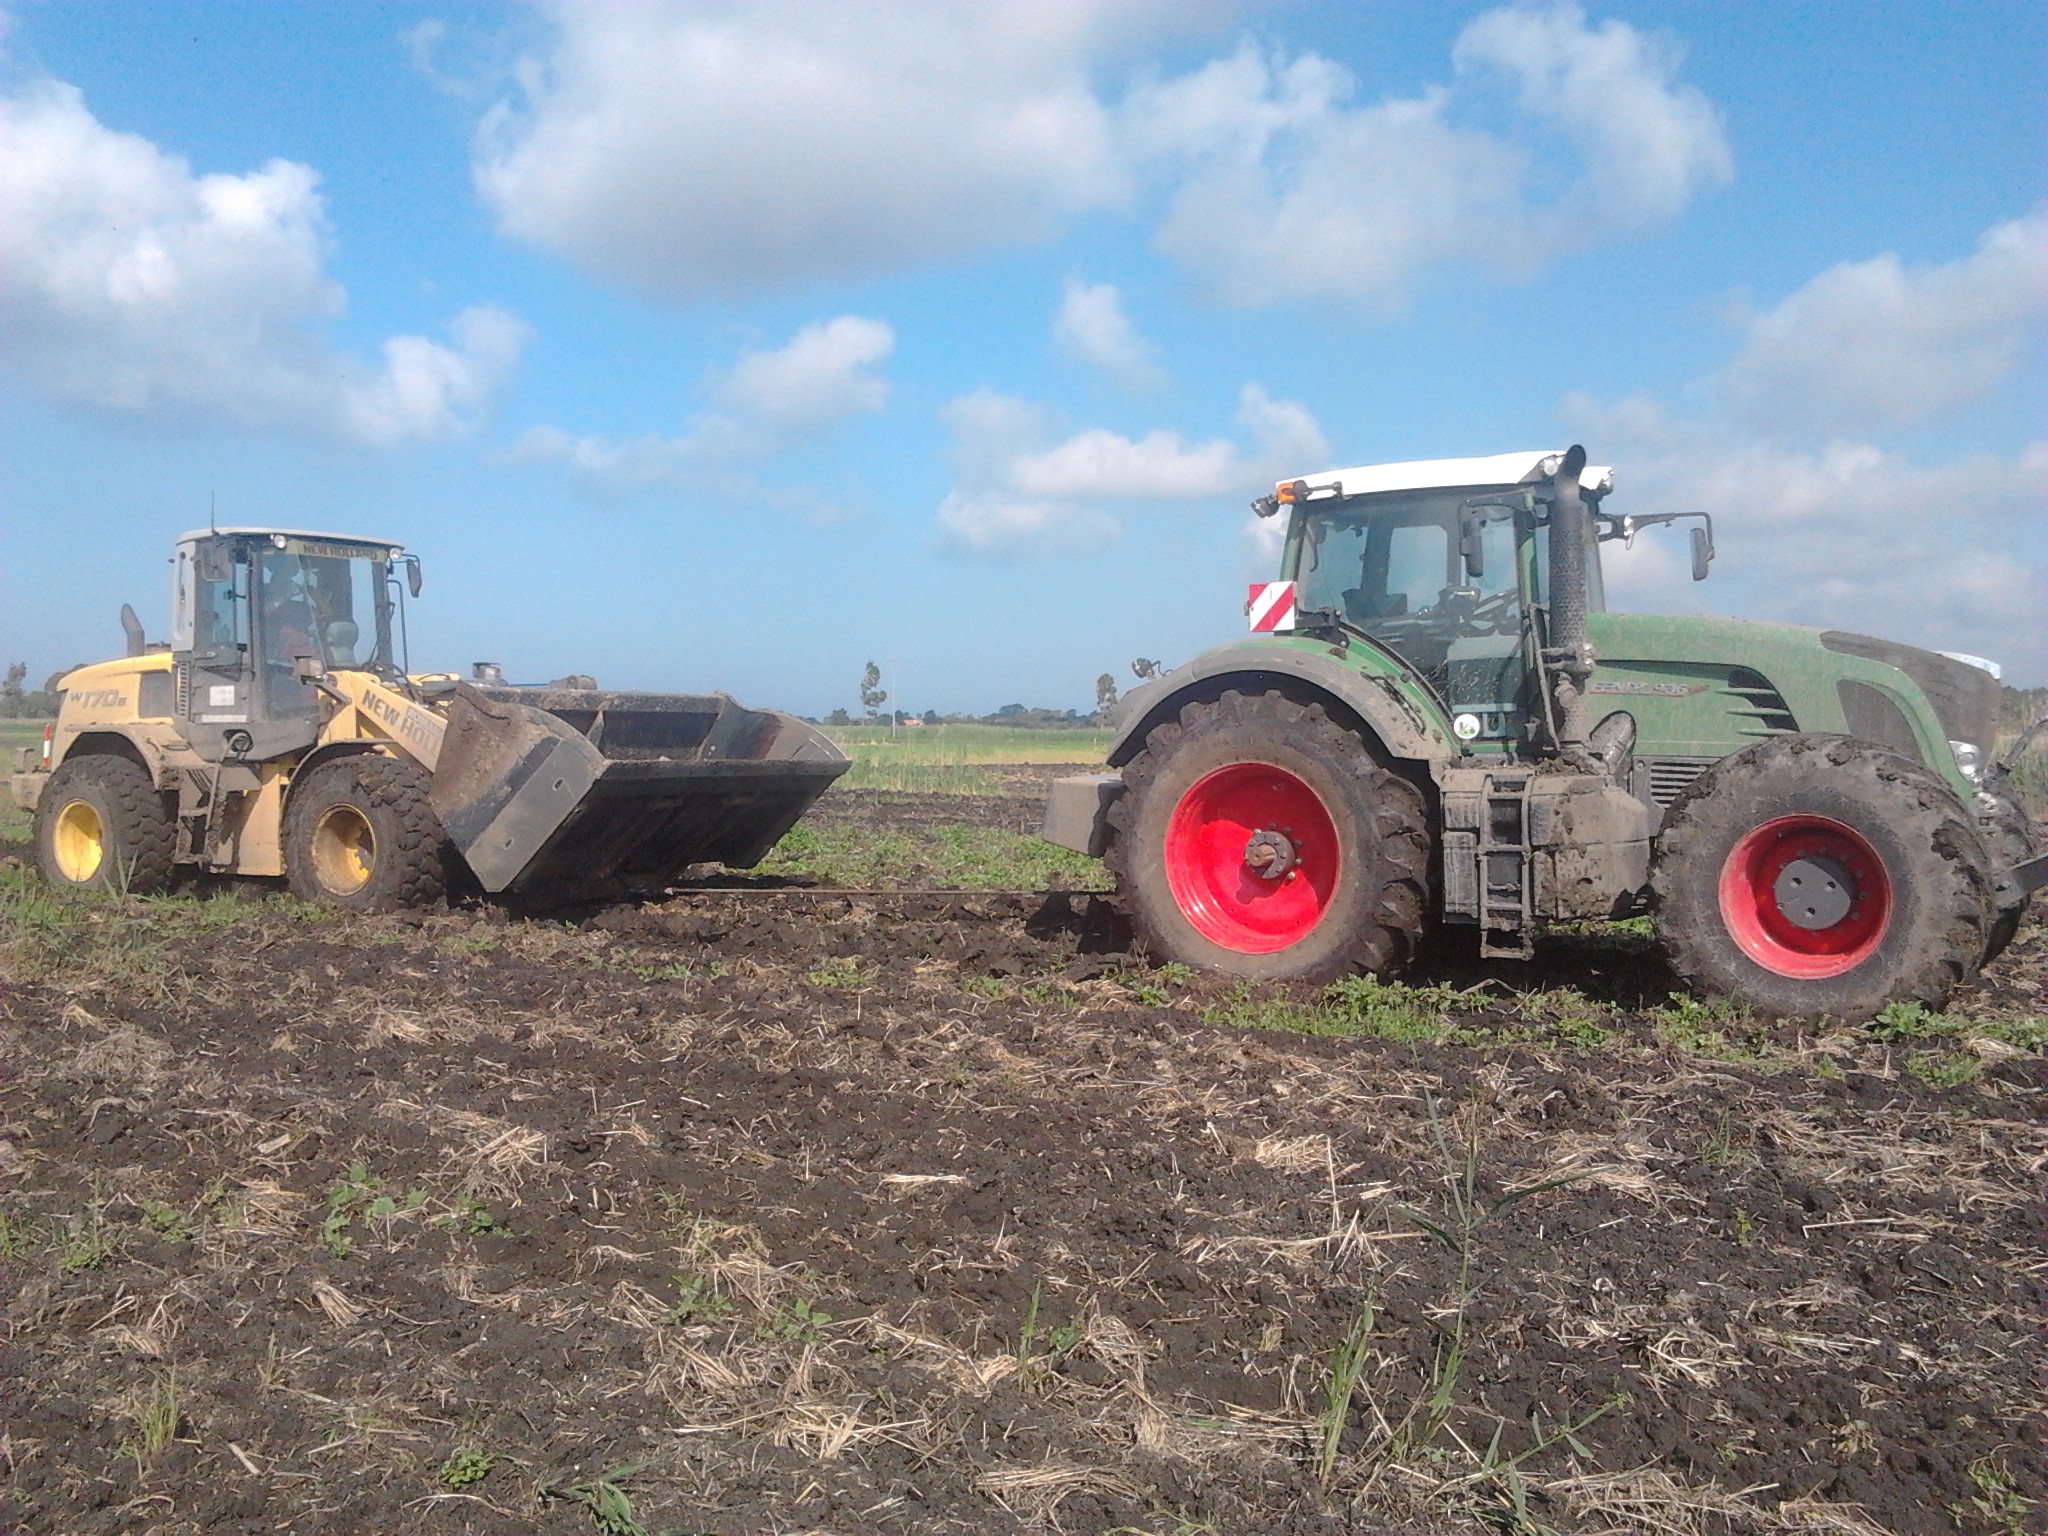
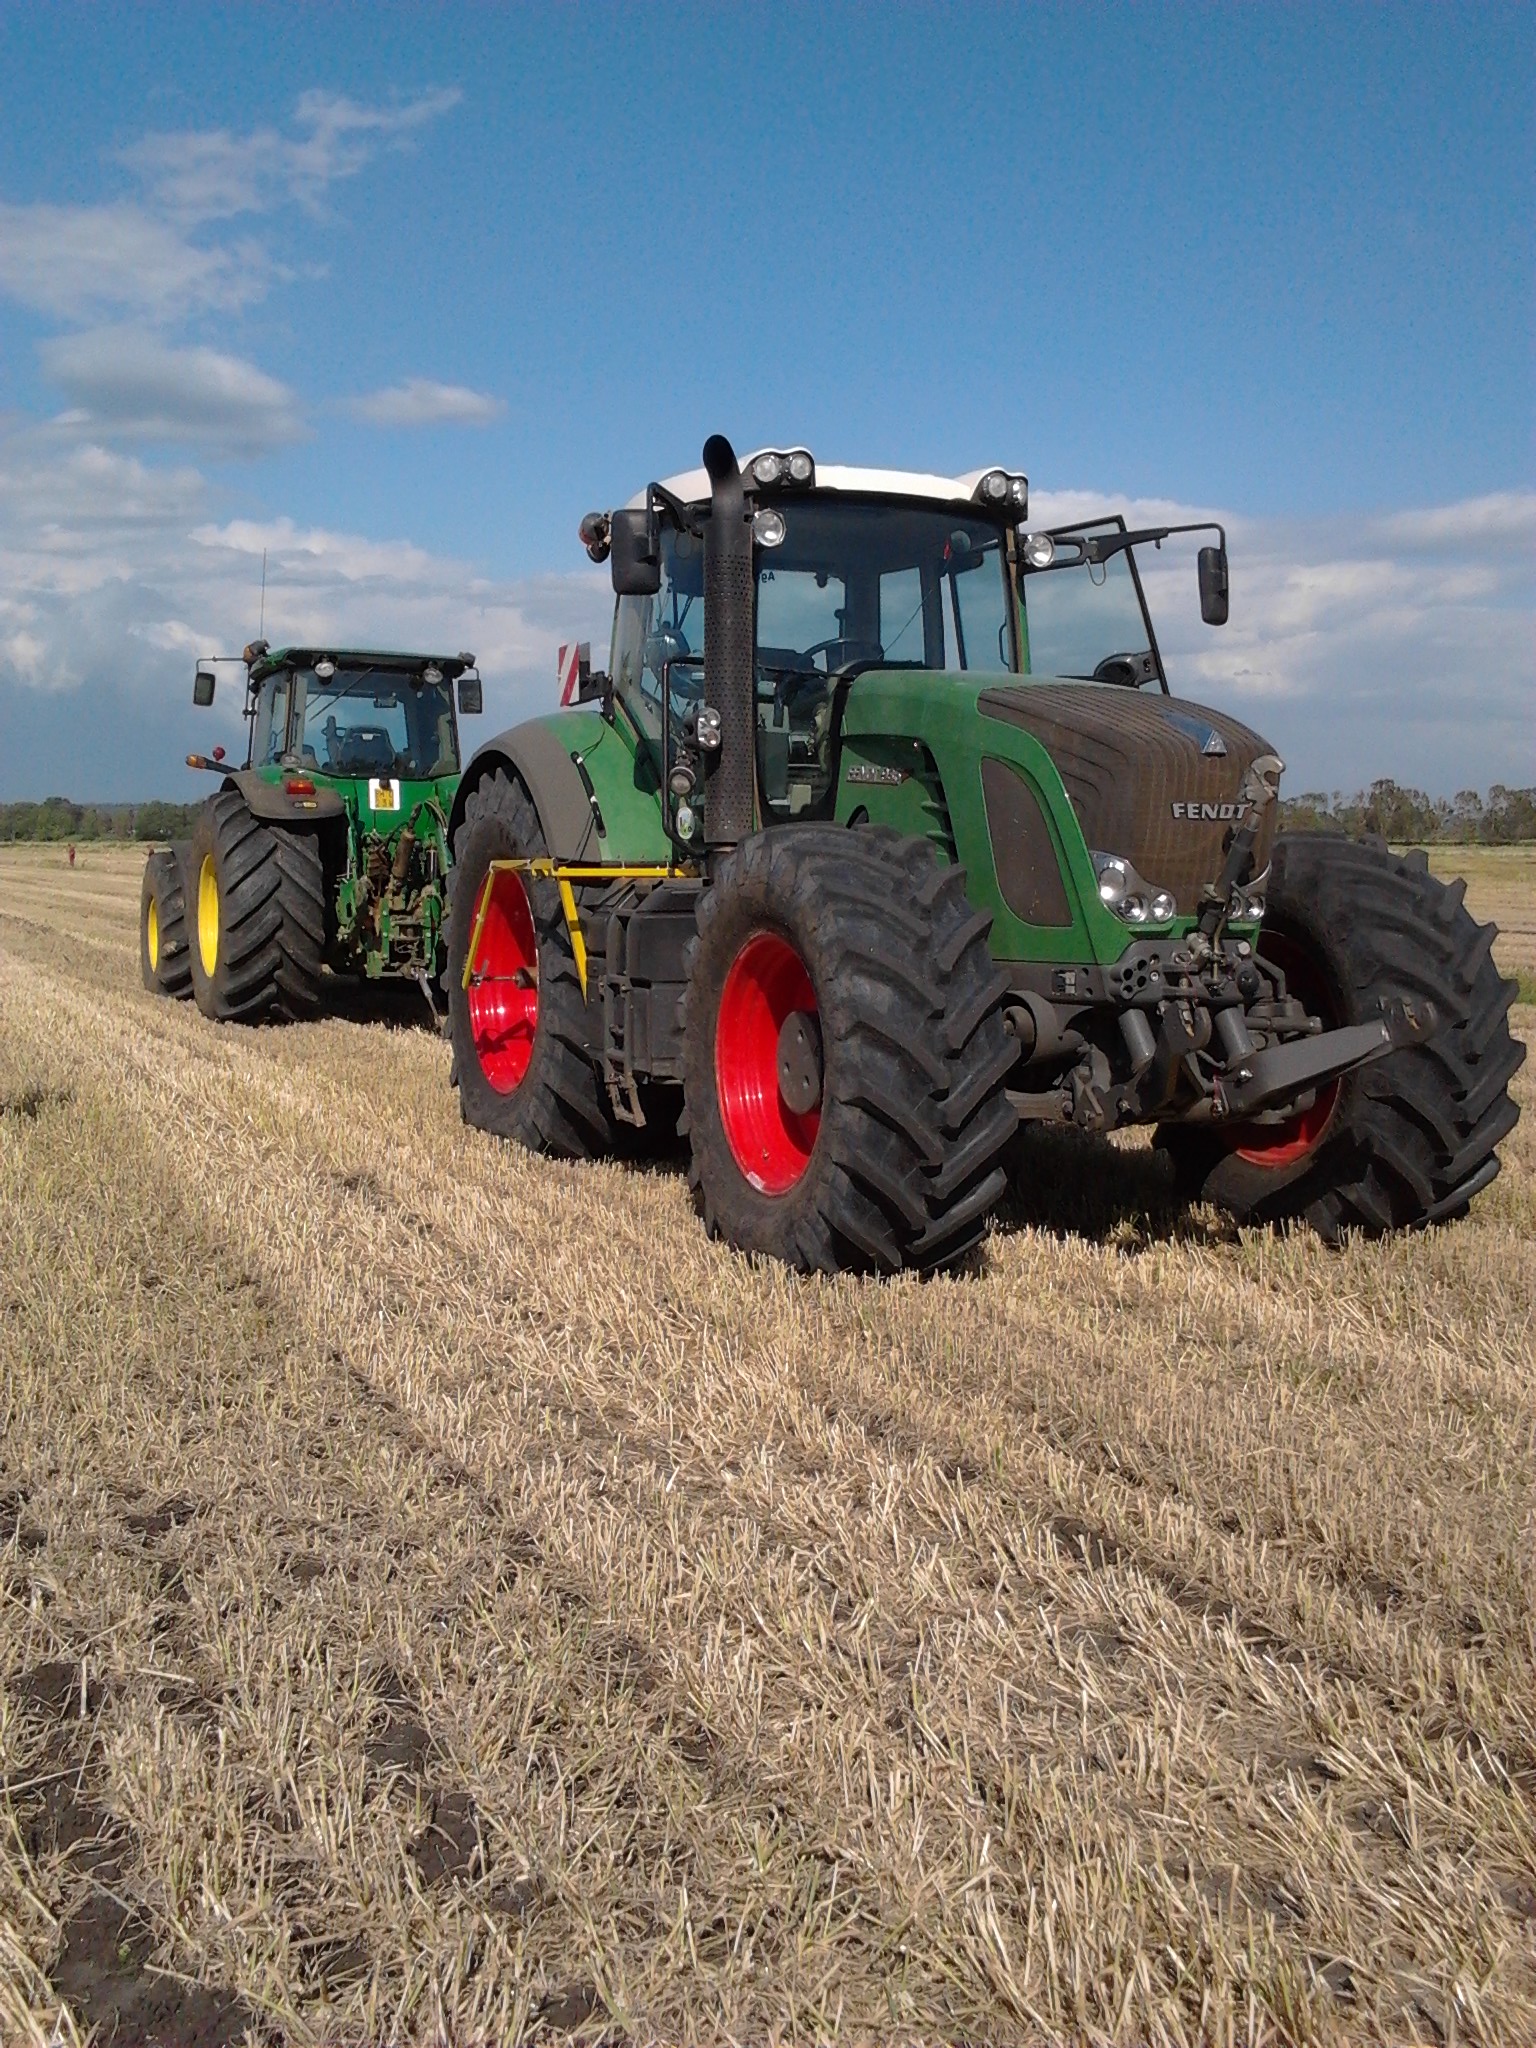
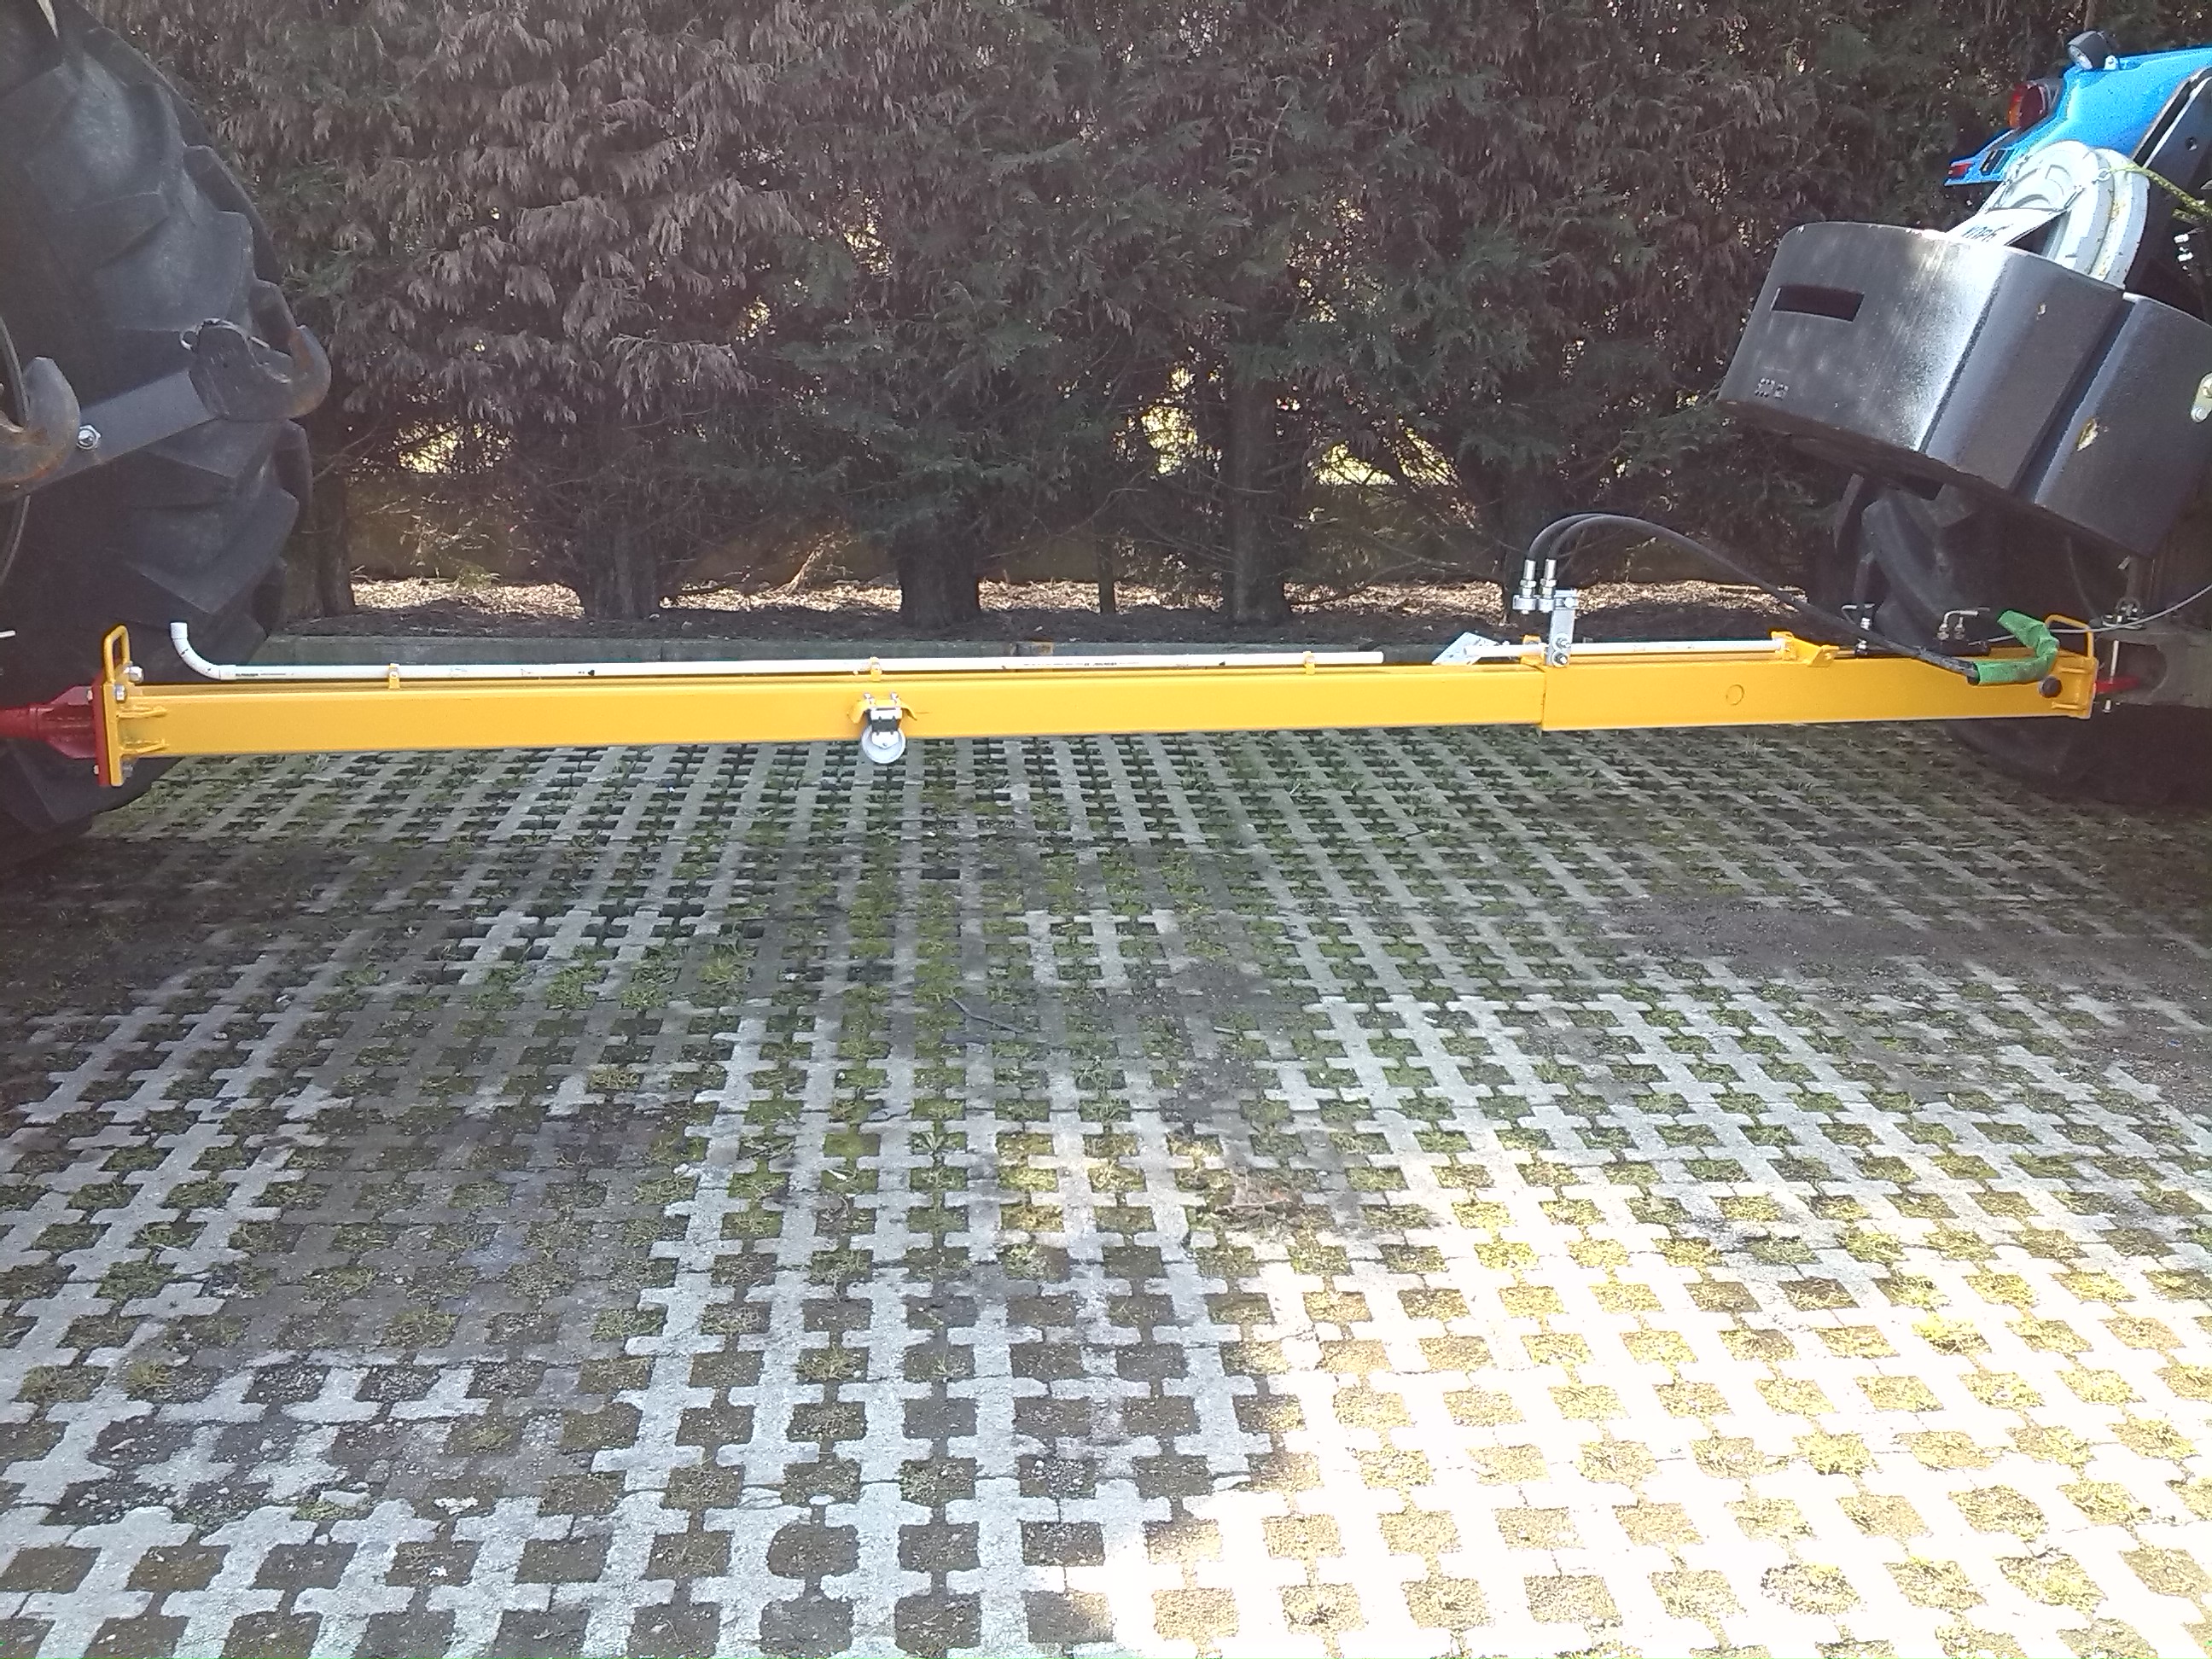
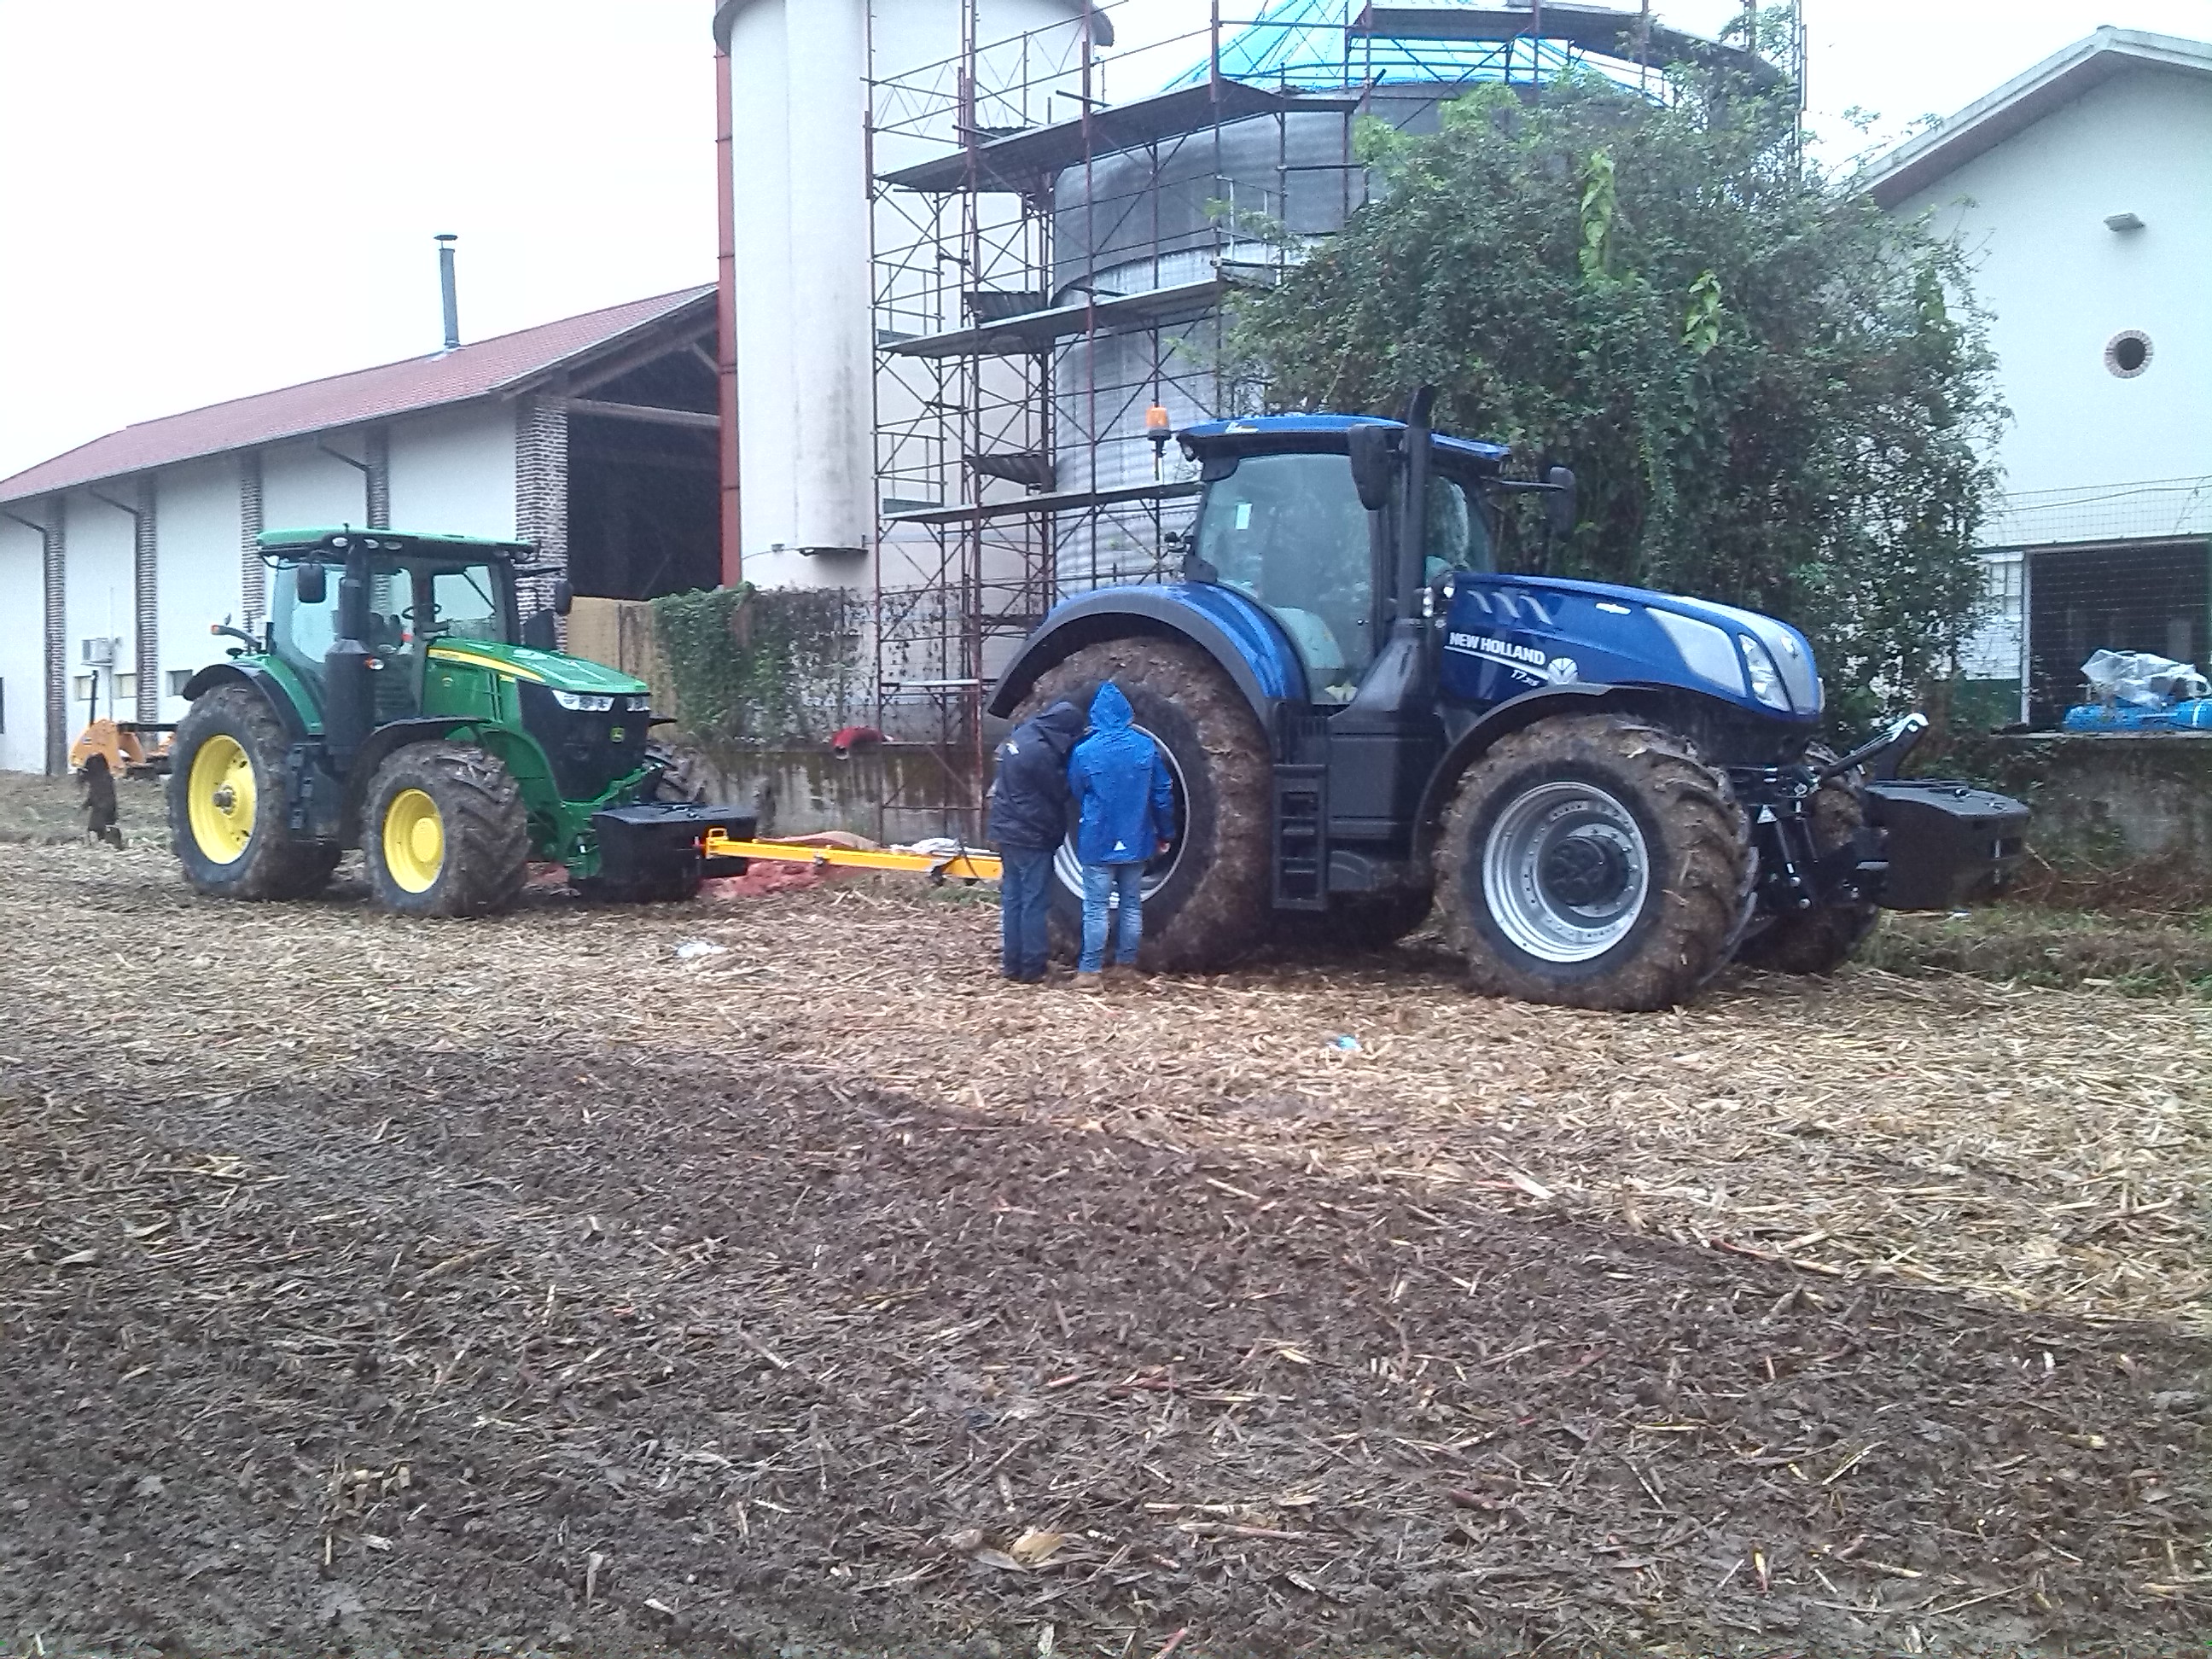
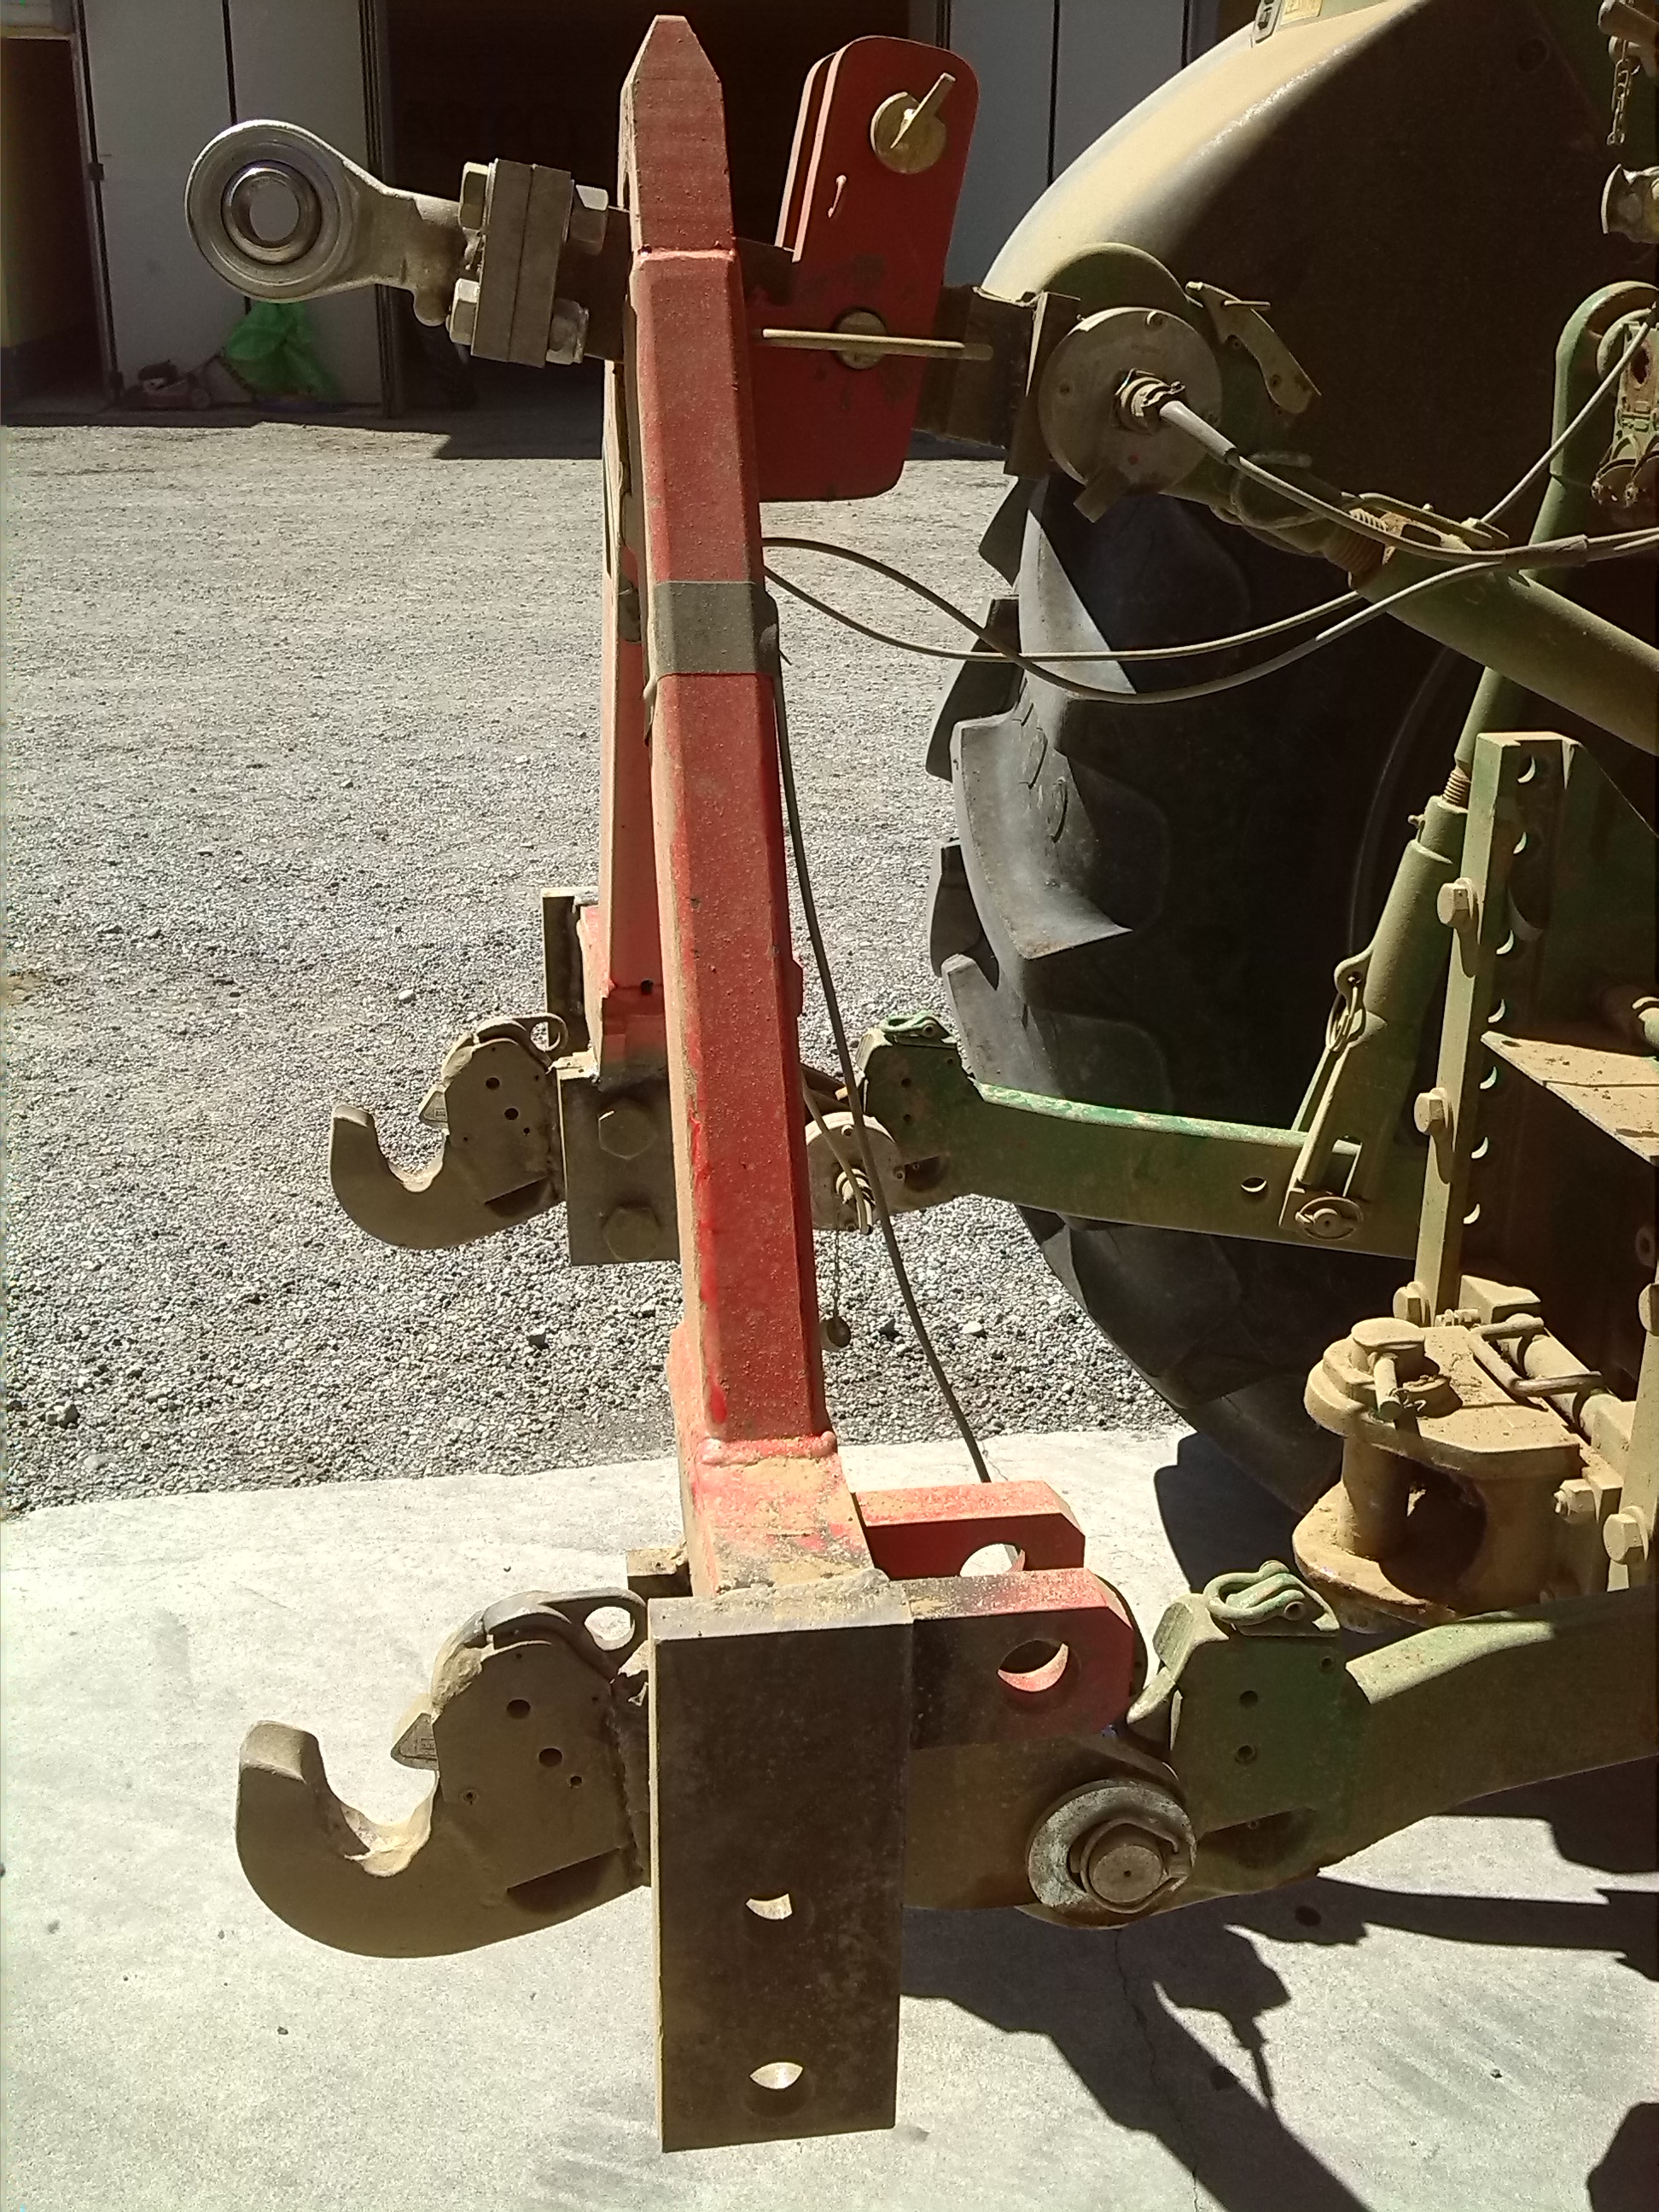
Finally i advertise the availability of Test Facilities like:
- Draw bar (for measuring ground traction and ground speed)
- 3rd and 4th category frames (three load cells provide traction force to the implement)
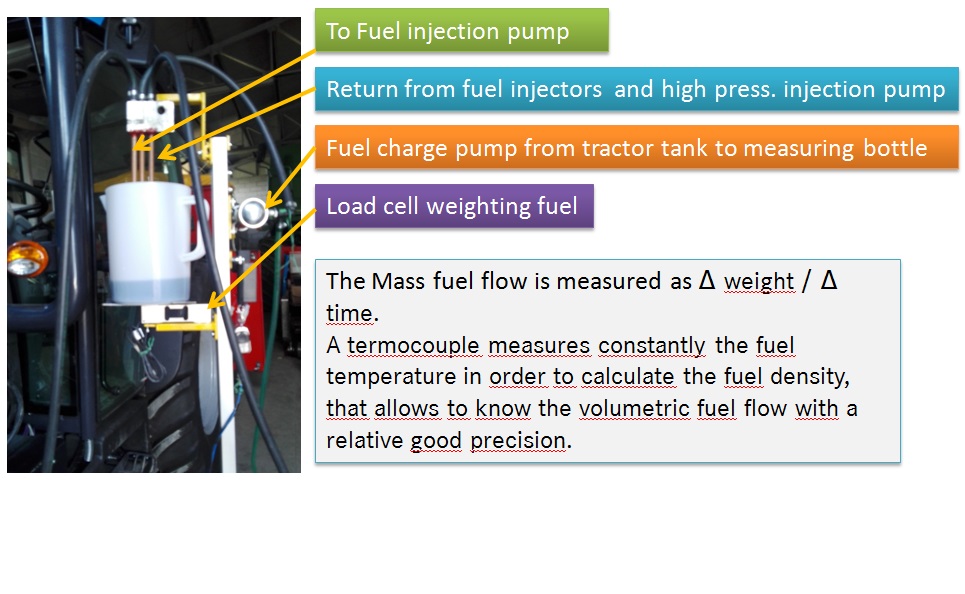
- Fuel and oil flow meters (for stationary and field tests)
- Software developed in NI Labview environment for log data and data analysis Real Time.
| Draw_Bar |
| Draw_Bar_NH |
| Draw_bar_video |
| Draw_Rar_Result_Real_Time |
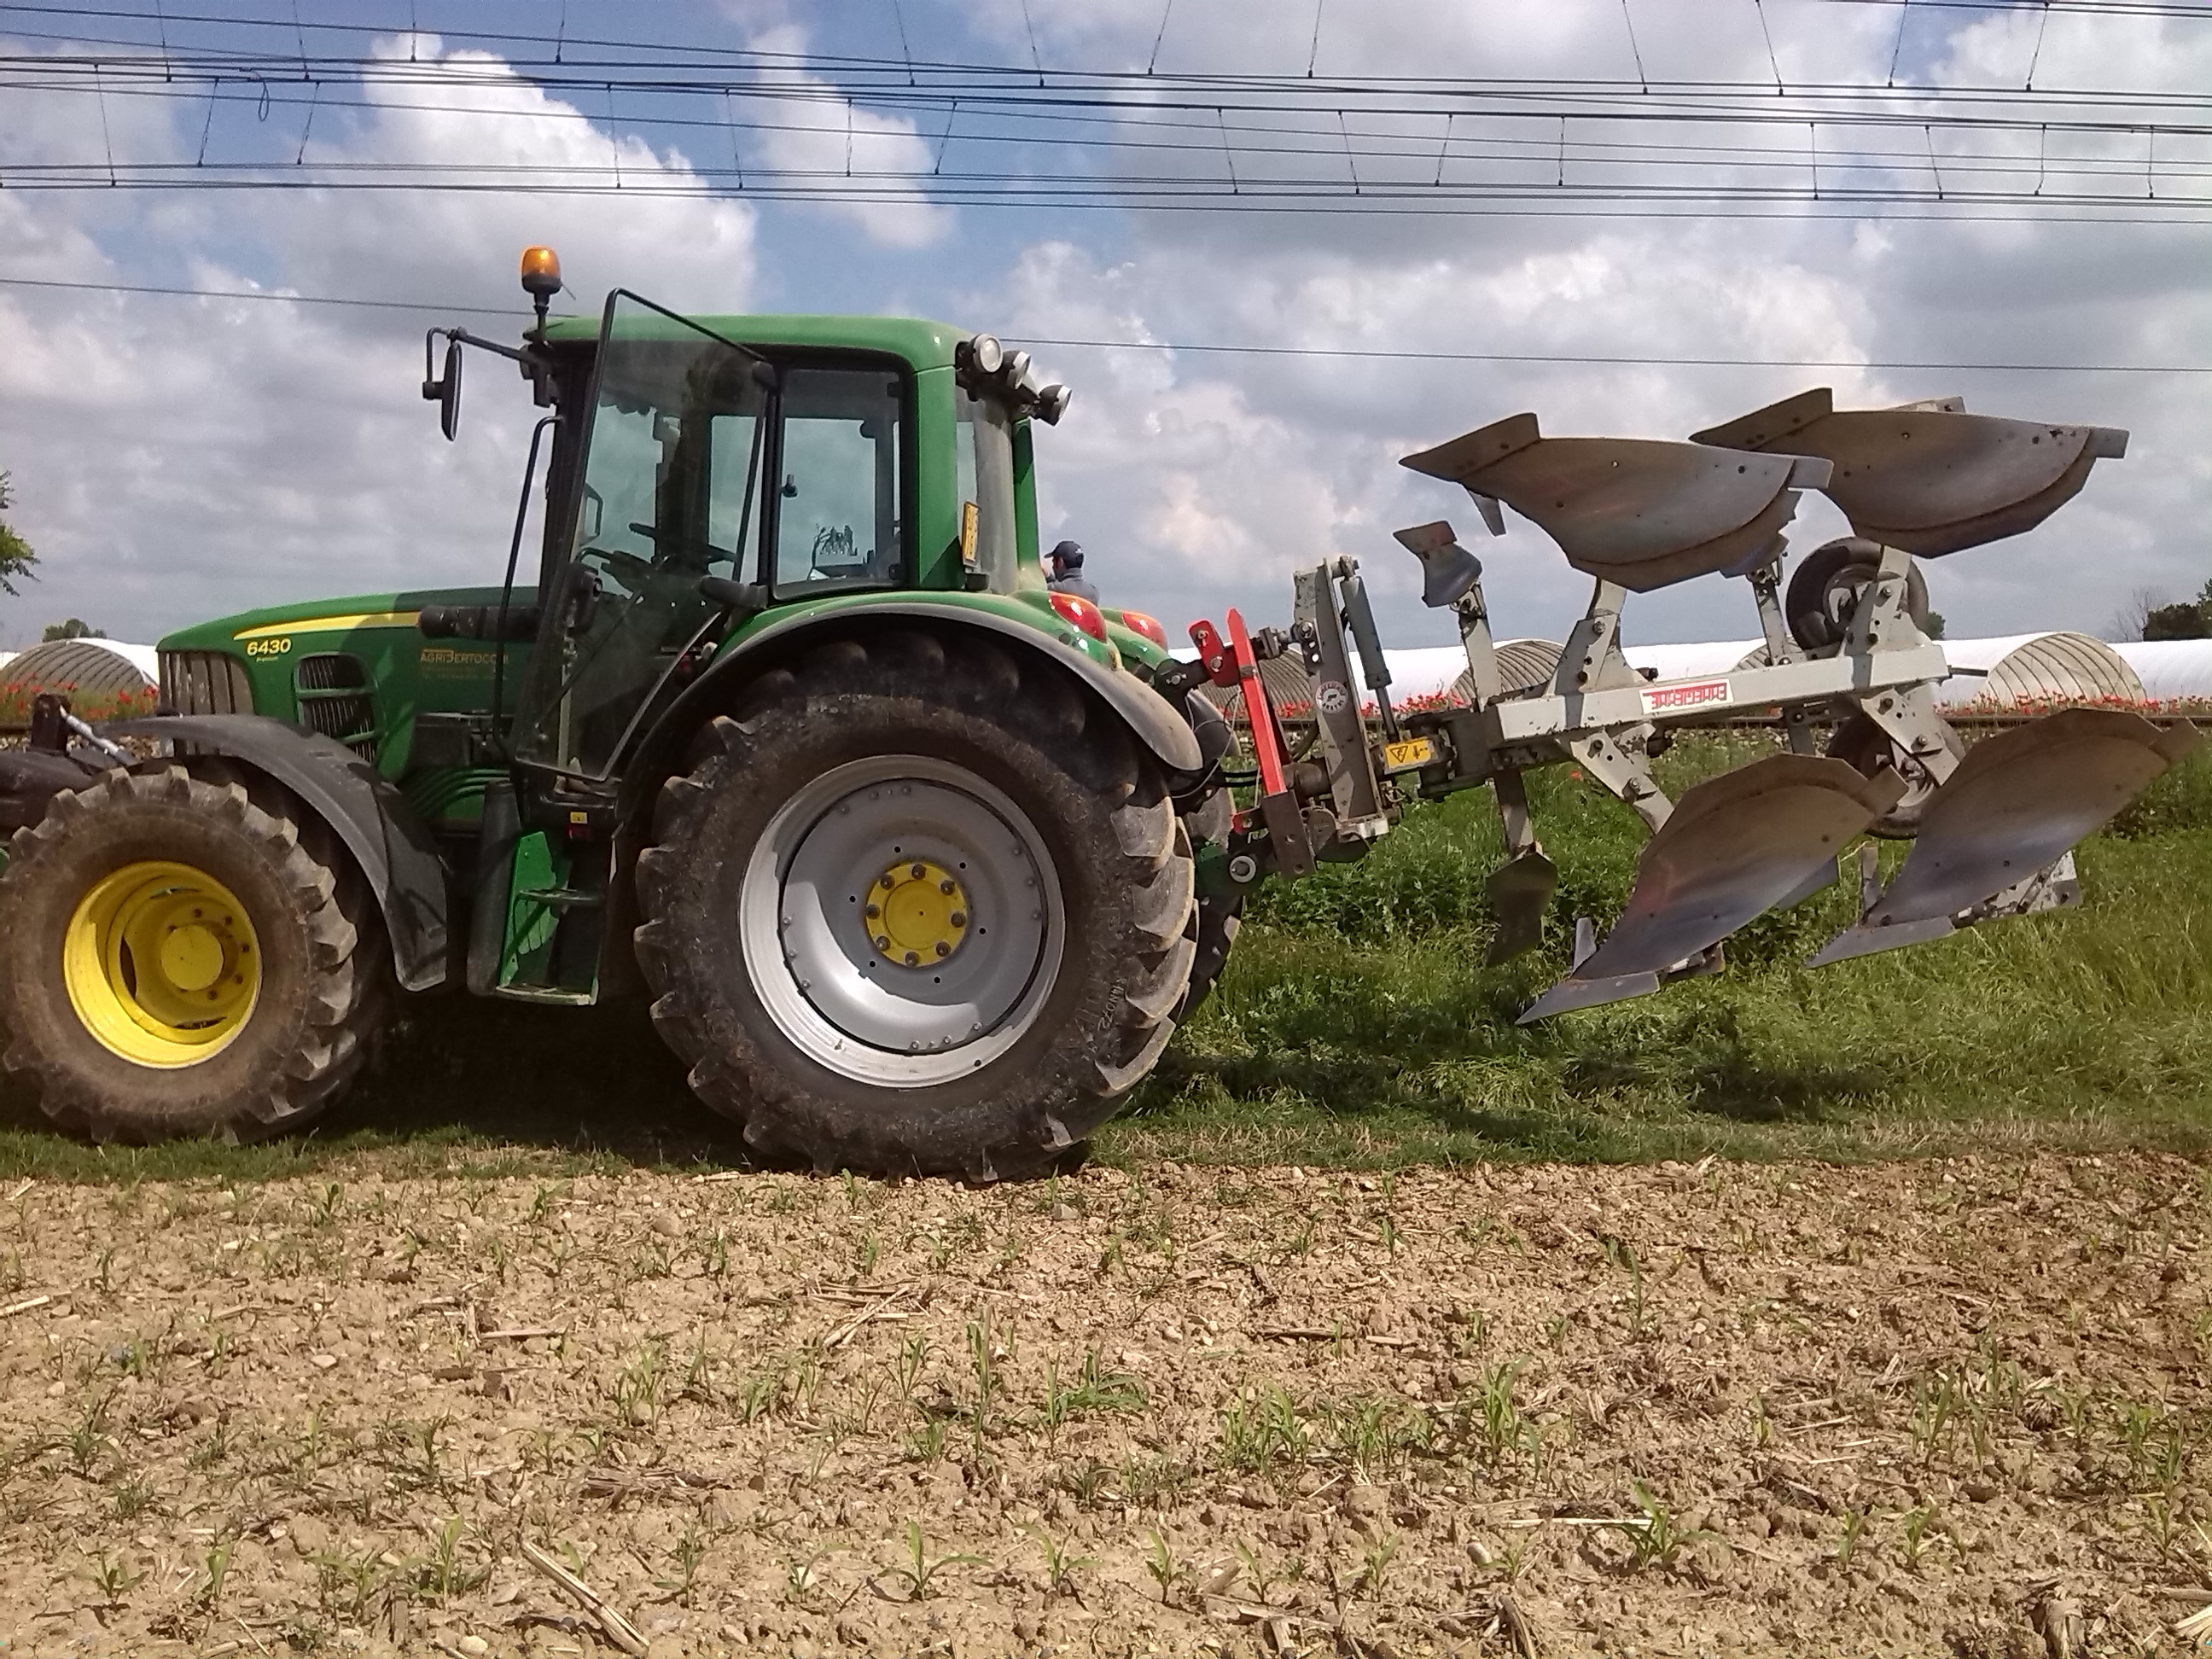
| 3PH_Frame |
| 3PH_Frame&Plough |
| Fuel FlowMeter |
Sorry, still
